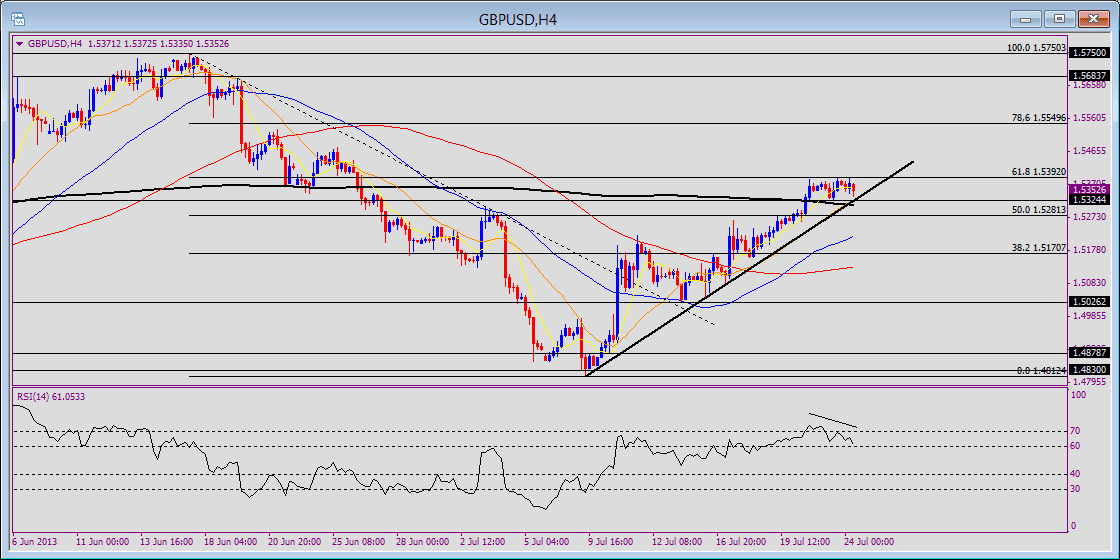
GBP/USD 4H chart 9/3/2013 8:35 ET
(click to enlarge)
Head and shoulders: After retreating from 1.5717 GBP/USD held above a previous support at 1.5421 and is now back up to test the 1.56 handle where it has so far shown resistance twice. Note that this is where a previous high in early August was made. A downswing that breaks below 1.55 refocuses on the 1.5421 pivot and therefore would be completing the right shoulder in a H&S pattern.
Trendline: Also note that the downswing below 1.55 would probably break below a rising trendline that is coming up from the 1.4813 July and 2013 low. Then, a break below the 1.5420 level opens up the 1.5101 pivot first before exposing the 1.4813 low.
Momentum: The RSI is at a key level, near 60. If it holds under 60, then it shows bearish momentum developing in the 4H chart, which accompanies the H&S and bearish correction scenario. A break above 60 into 70s should accompany a price break above 1.56, in which case, the market is likely refocused toward the 1.5717 August high, continuing a bullish outlook since bouncing off the 1.4813 low on the year.
Fan Yang CMT is a forex trader, analyst, educator and Chief Technical Strategist for FXTimes – provider of Forex News, Analysis, Education, Videos, Charts, and other trading resources.