GBP/USD 4H chart 7/24/2013 7:00AM ET
(click to enlarge)
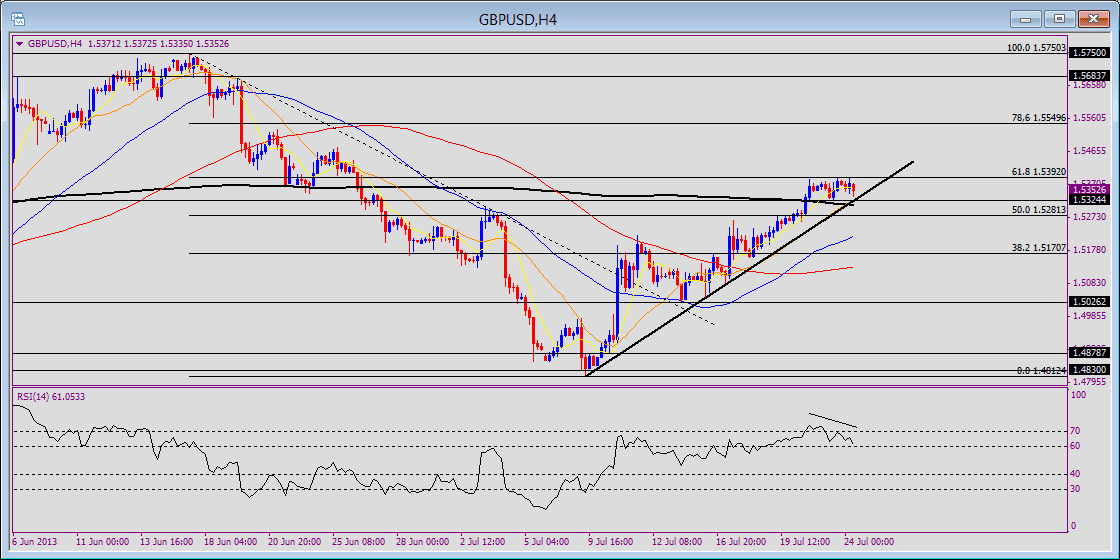
61.8% Retracement: The GBP/USD has been rallying from the 1.4812, 2013 and July low, and is stalling just below 1.54, where we have 61.8% retracement of the 1.5750-1.4812 decline. As 61.8% retracement acted as resistance, the relatively flat 200-4H-SMA was around the 1.5324 short-term support pivot.
Bearish divergences: The 4H chart shows a bearish divergence with the RSI as it tags 70. This shows the market is resolving some short-term overbought condition, and the bullish momentum is stalling. There was also a bearish divergence in the 1H chart below, but the overbought condition in this time-frame has been resolved, and the RSI is still above 40, reflecting maintenance of bullish momentum in the 1H time-frame.
Breakout scenarios: If the market pushes above 1.54, it is likely extending the bullish mode toward the next resistance pivots or around the 78.6% retracement level of 1.5550. However, if price falls below 1.5320, it would create a near-term top as well as break below a rising trendline from the 1.4812 low. This first opens up the 1.5170, 38.2% retracement which is near a previous pivot area, which is a little lower around 1.5155.
GBP/USD 1H chart 7/24/2013 7:10AM ET

(click to enlarge)
Fan Yang CMT is a forex trader, analyst, educator and Chief Technical Strategist for FXTimes – provider of Forex News, Analysis, Education, Videos, Charts, and other trading resources.