XAU/USD 4H chart 10/9/2013 6:42PM ET
(Click to enlarge)
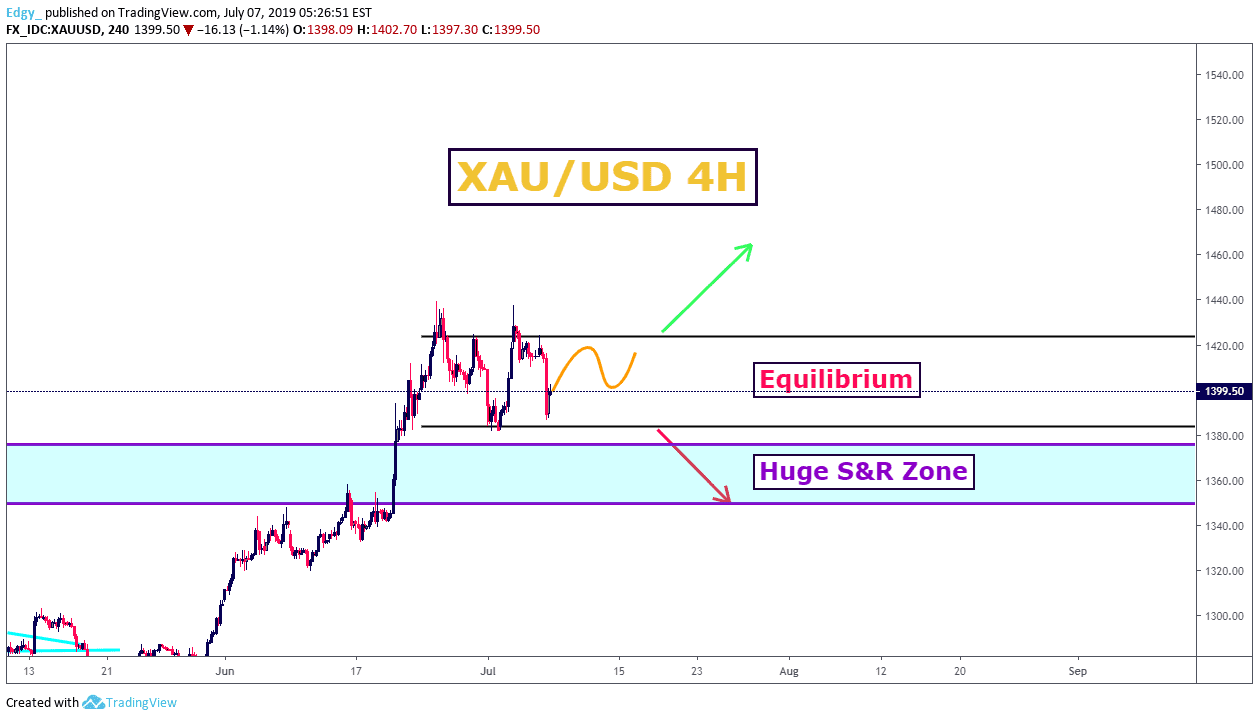
Falling trendline: Gold price was unable to clear above 1330 during the 10/8-9 sessions as it tested a falling trendline that comes down from the 1433.52 August high. After the failure to push above 1330, it retreated and fell below 1300 during the 10/9 session.
It traded around 1300 to end the session after the release of the FOMC minutes for the 9/17-18 monetary policy meeting. However, the bearish bias remains.
As we start the 10/10 Asian session, there could be some further pullback, but if the rally fails to clear back above mid-session pivot of 1315 and the falling trendline, the downside risk remains, with 1290 then 1277 as the next support pivots to test.
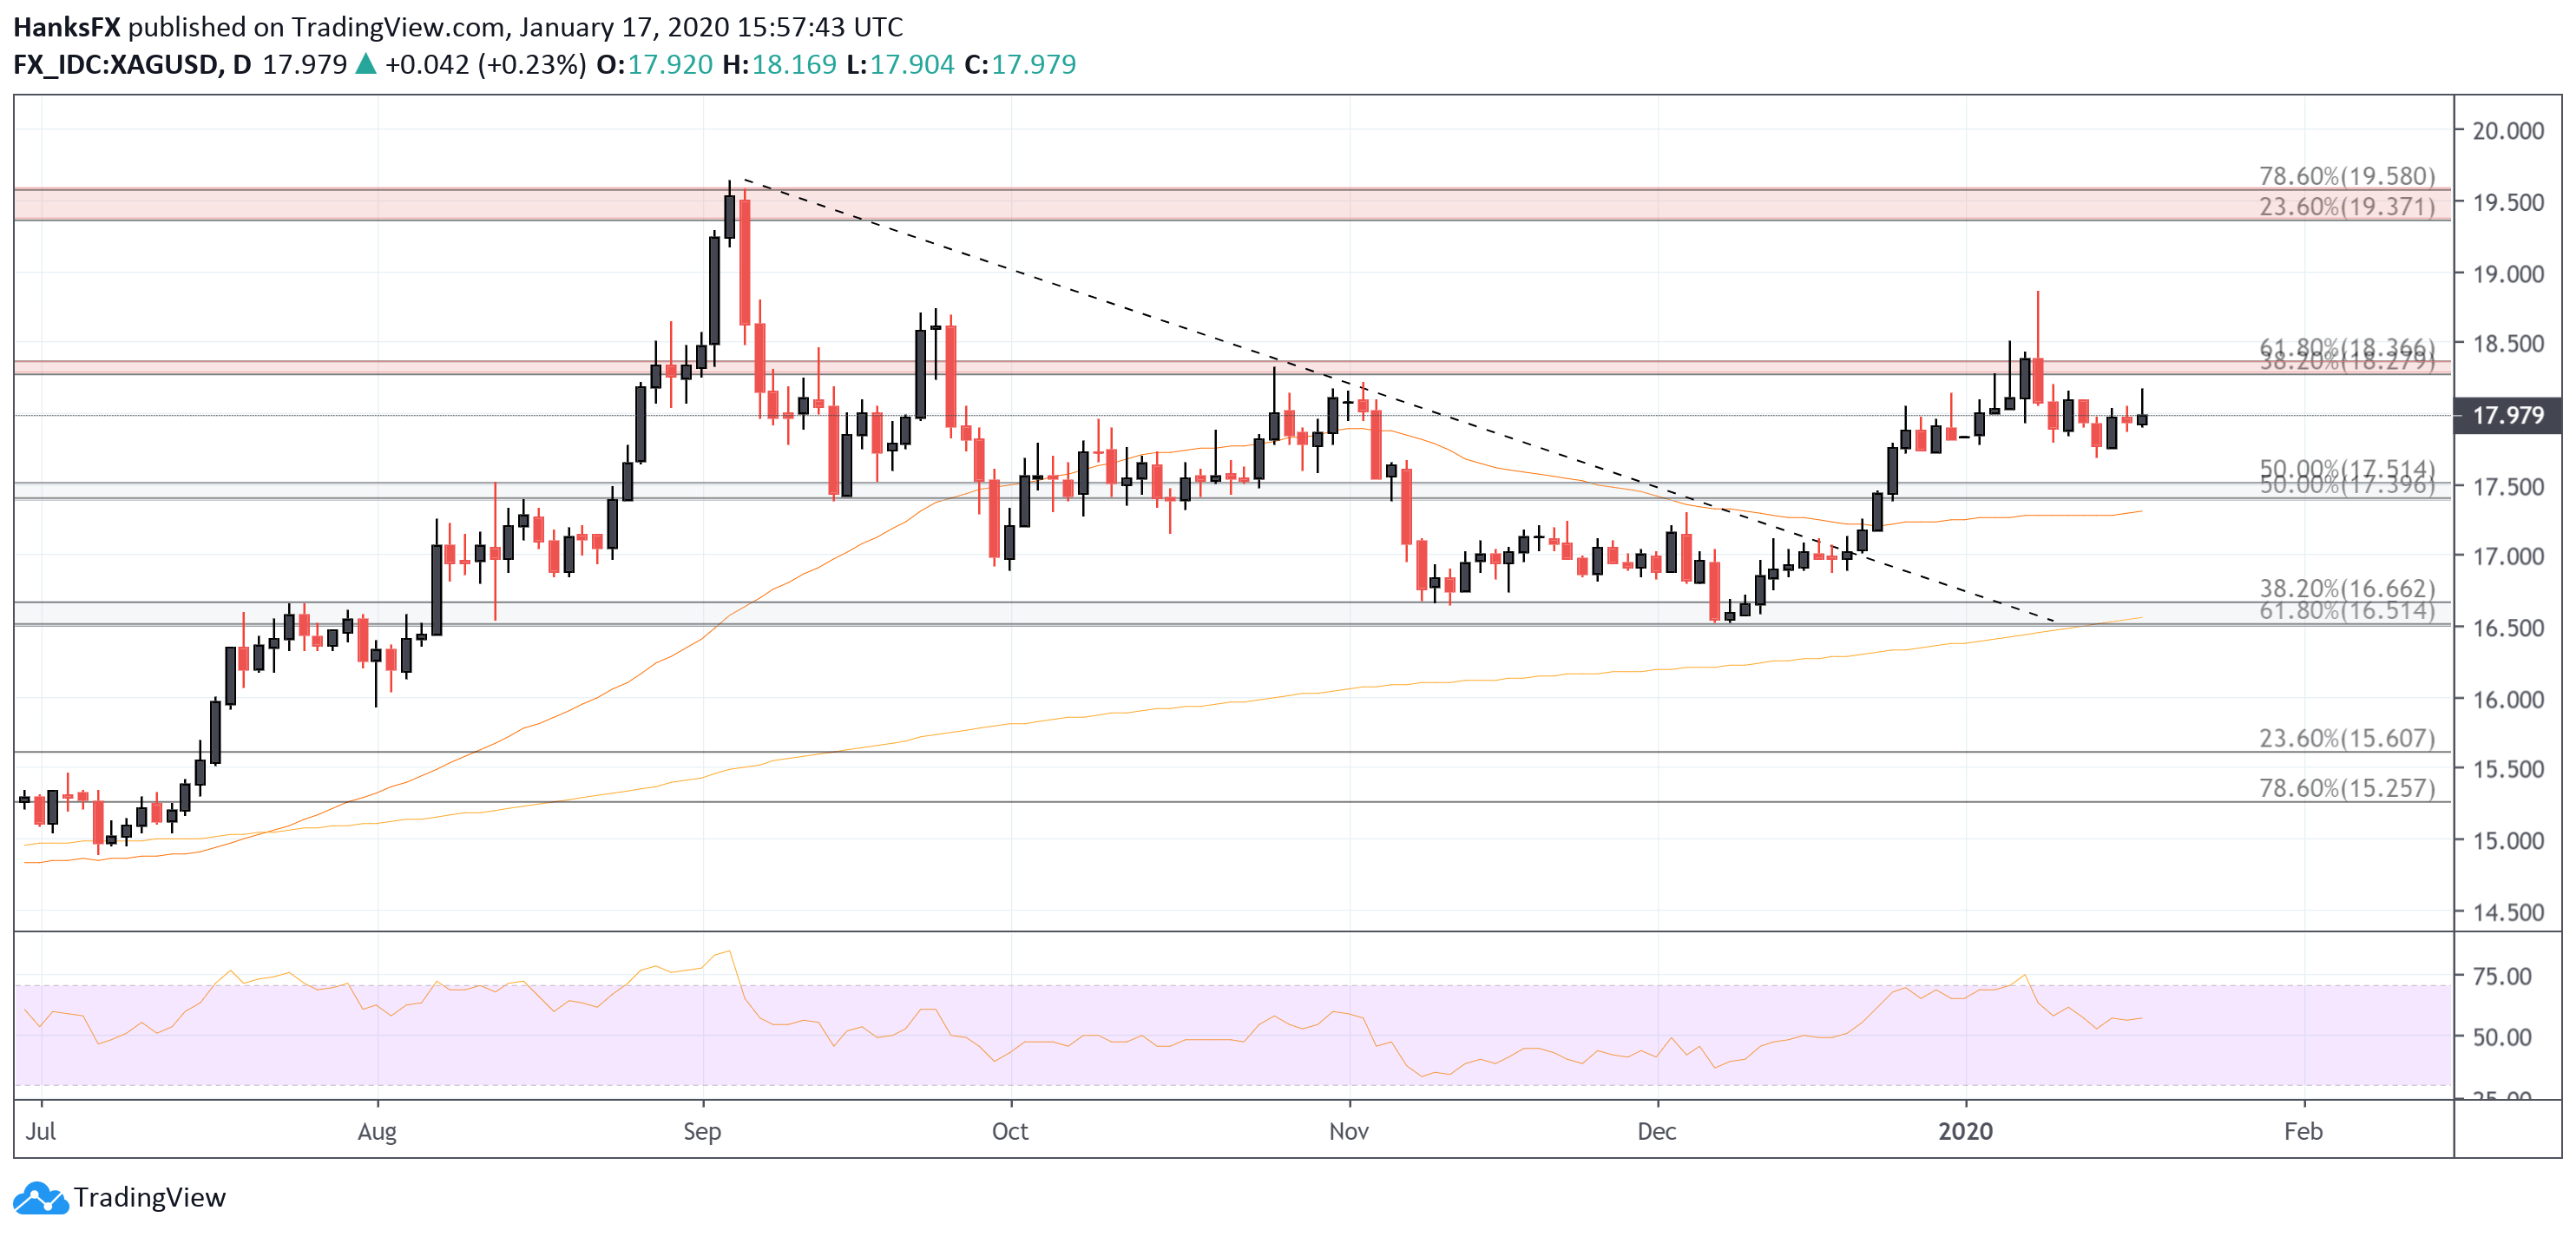
Support pivot: The daily chart shows that if gold clears back below the 1267 pivot from July, it can open up the next support pivot around 1209. The next key support below that is 1180, the 2013-low.
A rally above 1330 at this point should neutralize the bearish outlook in the near-term, but the bearish mode of 2013 will still be at play until a break above the August high of 1433.52, and a falling trendline that comes down from the 1795, Oct. 2012 high, which is where the current downtrend started from.
XAU/USD Daily chart 10/9/2013 6:50PM ET

Fan Yang CMT is a forex trader, analyst, educator and Chief Technical Strategist for FXTimes – provider of Forex News, Analysis, Education, Videos, Charts, and other trading resources.