Key Points
- The US Dollar gained traction against the Japanese yen before it found resistance near 106.35.
- There is a contracting triangle pattern formed on the hourly chart of the USDJPY pair, which is acting as a catalyst for the pair.
- The US Consumer Price Index released by the US Bureau of Labor Statistics posted a rise of 1%, which was less than the forecast of 1.1%.
- The Empire State Manufacturing Survey conducted by the Federal Reserve Bank of New York declined from the last reading of 6.01 to 0.55 in July 2016.
Technical Analysis
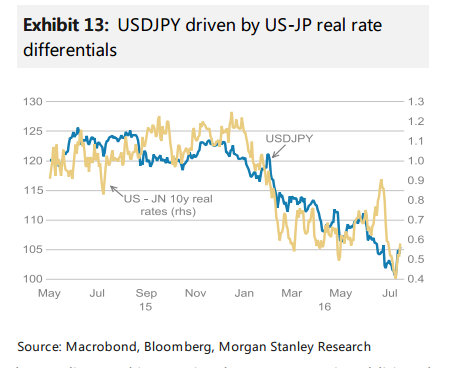
The US Dollar is an uptrend against the Japanese yen, but it is struggling to clear the 106.35 level. Currently, there is a contracting triangle pattern formed on the hourly chart of the USDJPY pair, which is acting as a support for the pair.

If the pair breaks the highlighted triangle support area, then a move towards the 21 hourly simple moving average is possible.
On the upside, we need to keep an eye on the 106.00 level as a resistance.
US CPI
Earlier today, the US CPI, which captures the changes in the price of goods and services was released by the US Bureau of Labor Statistics. The market was expecting a rise of 1.1% in June 2016, compared with the same month a year ago. However, the result was disappointing, as there was a rise of only 1%.
The report stated that “For the second consecutive month, increases in the indexes for energy and all items less food and energy more than offset a decline in the food index to result in the seasonally adjusted all items increase. The food index fell 0.1 percent, with the food at home index declining 0.3 percent“.
Overall, the US Dollar came under pressure after the release, and may trade a few pips lower against the Japanese yen.


