After reporting a jump in U.S. pending home sales in the previous month, the National Association of Realtors released a report on Thursday showing a sharp pullback in pending home sales in the month of August.
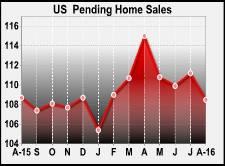
NAR said its pending home sales index tumbled by 2.4 percent to 108.5 in August after surging up by 1.2 percent to a revised 111.2 in July. Economists had expected pending sales to come in roughly flat.
With the steep drop during the month, the pending home sales index fell to its lowest level since hitting 105.4 in January. Pending sales were also down by 0.2 percent compared to a year ago.
A pending home sale is one in which a contract was signed but not yet closed. Normally, it takes four to six weeks to close a contracted sale.
NAR chief economist Lawrence Yun said, "Contract activity slackened throughout the country in August except for in the Northeast, where higher inventory totals are giving home shoppers greater options and better success signing a contract."
"In most other areas, an increased number of prospective buyers appear to be either wavering at the steeper home prices pushed up by inventory shortages or disheartened by the competition for the miniscule number of affordable listings," he added.
The decline in pending home sales was partly due to a pullback in the Western region, where pending sales tumbled by 5.3 percent in August after surging up by 7.1 percent in July.
Pending home sales in the South also slumped by 3.2 percent and pending sales in the Midwest fell by 0.9 percent, while pending sales in the Northeast rose 1.3 percent.
NAR said Yun expects existing home sales to be around 5.36 million in 2016, a 2.1 percent increase from 2015 and the highest annual pace since 2006. Median existing home price growth is forecast at 4 percent.
by RTT Staff Writer
For comments and feedback: editorial@rttnews.com
Economic News
What parts of the world are seeing the best (and worst) economic performances lately? Click here to check out our Econ Scorecard and find out! See up-to-the-moment rankings for the best and worst performers in GDP, unemployment rate, inflation and much more.