Key Points
- The US dollar enjoyed a decent ride, as gold prices vs the USD declined below $1265.
- There is currently a range pattern formed on the hourly chart of Gold, which may provide us the next move.
- Today in China, the Trade Balance was released by the General Administration of Customs of the People’s Republic of China.
- The outcome was on the lower side, as the trade surplus was $41.989B in Sep 2016, less than the forecast of $53.000B.
Gold Price Technical Analysis
There was a downside move in Gold price recently, pushing it below $1265 against the US Dollar. The price is currently recovering, and formed a range pattern formed on the hourly chart. The price is currently above the 21 hourly simple moving average, but it is mostly consolidating.

There is a channel formation, which once broken could open the doors for the next move.
The chances of a downside move are more since the higher timeframe chart is currently bearish.
Chinese Trade Balance
Today in China, the Trade Balance, which is a balance between exports and imports of total goods and services was released by the General Administration of Customs of the People’s Republic of China.
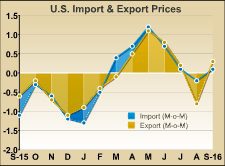
The market was expecting a trade surplus of $53.000B in Sep 2016, but it came in at $41.989B. There was a decline in both imports and exports by 1.9% and 10% respectively. The outcome is somehow not good for Gold buyers, but the impact was not much in the short term. Later today, the US Import Price Index will be reported by the US Department of Labor, which may create swing moves in Gold price.
Overall, Gold price may remain in a range, but once there is a break, we can witness a nice ride in the short term.