Key Points
- The Aussie dollar after trading as high as 1.0635 against the New Zealand Dollar started a correction.
- There is a bullish trend line formed on the hourly chart of the AUDNZD pair, which may provide support on the downside.
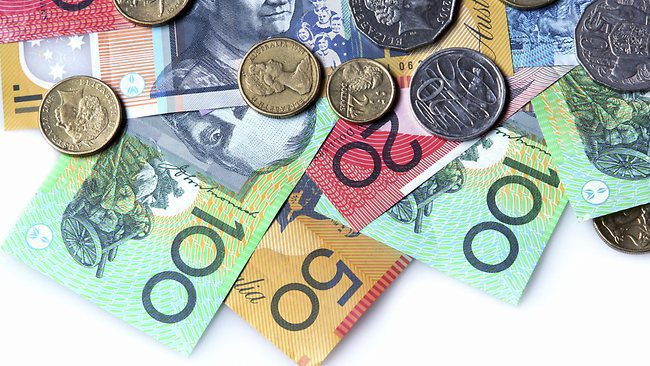
- The Australian trade balance was released by the Australian Bureau of Statistics today.
- The market was expecting a trade deficit of -2,300M in August 2016, but it came in at -2,010M.
AUDNZD Technical Analysis
The Aussie dollar recently traded towards 1.0640 versus the New Zealand Dollar, where it found sellers. The AUDNZD pair started a correction and currently approaching a bullish trend line formed on the hourly chart.

The 21 hourly simple moving average is also on the downside, waiting to act as a support along with the 38.2% Fib retracement level of the last wave from the 1.0509 low to 1.0635 high.
One may consider buying dips in AUDNZD, as long as it is above the 1.0580-550 support area.
Australian Trade Balance
Today in Australia, the trade balance, which is the difference in the value of its imports and exports of Australian goods was released by the Australian Bureau of Statistics.
The market was expecting a trade deficit of -2,300M in August 2016. However, the result was above the forecast, as it came in at -2,010M. The report stated that in “trend terms, the balance on goods and services was a deficit of $2,239m in August 2016, an increase of $8m on the deficit in July 2016. In seasonally adjusted terms, the balance on goods and services was a deficit of $2,010m in August 2016, a decrease of $111m (5%) on the deficit in July 2016”.
Overall, it looks like the Aussie dollar may decline in the short term, but remains supported near 1.0580 versus the NZD.