Key Points
- The US Dollar traded lower during the past two sessions against the Japanese yen, and declined below 114.00.
- There was a bullish trend line formed on the hourly chart of USDJPY, which was broken near 114.80 for a downside move.
- Today in Japan, the All Industry Activity Index was released by the Ministry of Economy, Trade and Industry.
- The result was positive, as there was a rise of 0.3% in Nov 2016, compared with the previous month.
USDJPY Technical Analysis
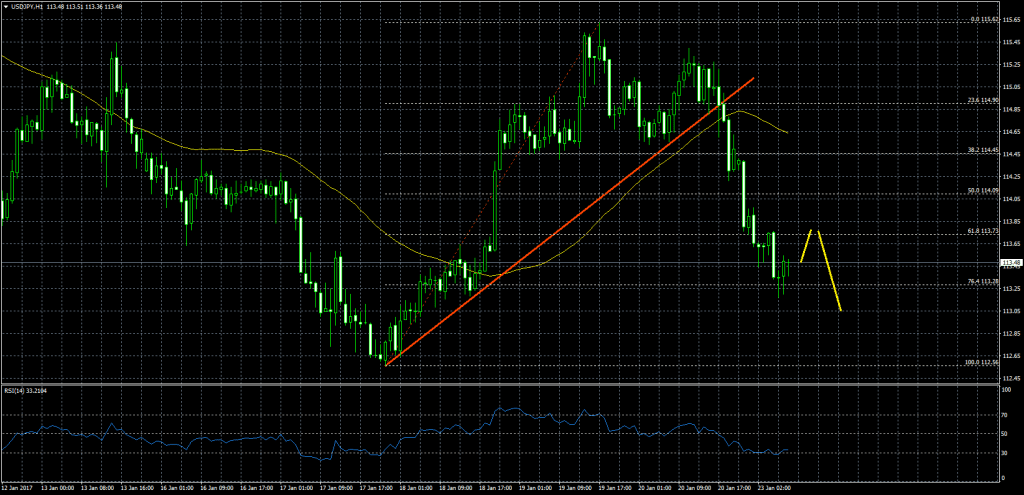
The Japanese yen managed to gain traction lately, which pushed the US Dollar down. The USDJPY pair traded lower and broke the 115.00 support area for a downside move. It later traded below the 114.00 support as well.
The pair during the downside move broke a bullish trend line formed on the hourly chart of USDJPY at 114.00, and also traded below the 100 hourly simple moving average. Lastly, the pair also closed below the 50% fib retracement level of the last wave from the 112.56 low to 115.62 high.
So, the USDJPY is in a downtrend, and any major recovery from the current levels may present selling opportunity near 114.00.
Japanese All Industry Activity Index
Today in Japan, the All Industry Activity Index, which captures the monthly change in overall production by all industries of the Japanese economy was released by the Ministry of Economy, Trade and Industry. The market was not expecting any major increase in Nov 2016, compared with the previous month.
However, the result was mixed, and more towards the positive side, as there was an increase of 0.3% in Nov 2016. However, the last reading was revised down from 0.2% to 0%.
Overall, there may be more downsides in USDJPY, and if the pair recovers, then the broken support at 114.00 may now act as a resistance.