Key Points
- The US Dollar is slowly moving down against the Japanese yen, and trading below the 117.50 resistance.
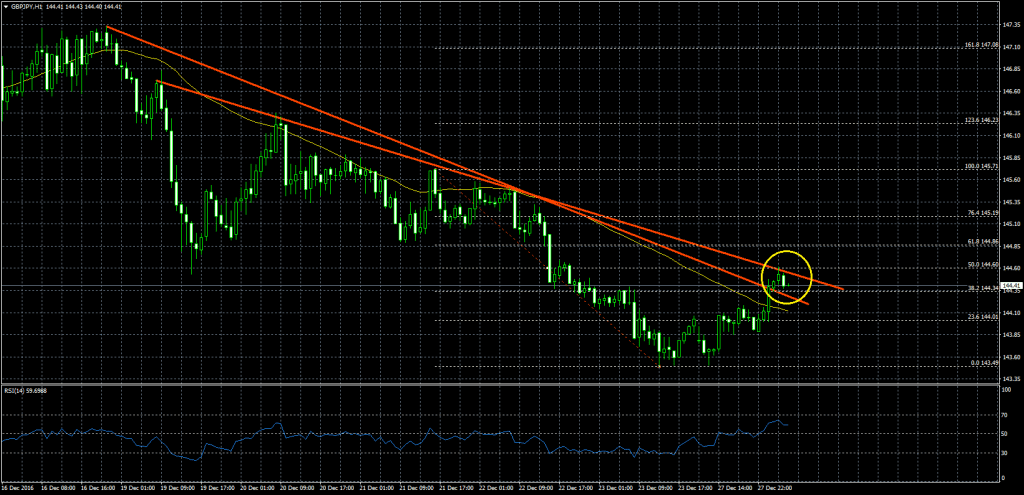
- There is a crucial bearish trend line formed on the hourly chart of USDJPY, which is acting as a resistance on the upside near 117.50.
- Today in Japan, the National Consumer Price Index was released by the Statistics Bureau.
- The result was on the positive side, as there was an increase of 0.5% in Nov 2016, compared with Nov 2015.
USDJPY Technical Analysis
The US Dollar was slowly seen moving down against the Japanese yen, and it moved below the 117.50 support area, which is now acting as a resistance. The USDJPY pair is also below a crucial bearish trend line formed on the hourly chart.

The highlighted trend line is also positioned with the 21 hourly simple moving average. So, we can say there is a major resistance and sell zone at 117.50.
On the downside, the 61.8% Fib retracement level of the last wave from the 116.52 low to 118.21 high is acting as a short-term support.
Japanese National Consumer Price Index
Today, the Japanese National Consumer Price Index, which is a measure of price movements obtained by comparison of the retail prices of a representative shopping basket of goods and services was released by the Statistics Bureau.
The market was positioned for a minor rise in Nov 2016, compared with the same month a year ago. However, the result was on the positive side, as there was an increase of 0.5% in Nov 2016. When we have a look at the monthly change, there was a positive reading.
Overall, the result was better, which is helping the Japanese yen. So, there are chances of more dips in USDJPY.