Key Points
- The US Dollar traded higher recently against the Japanese yen, but failed to break 118.20.
- There is a bearish trend line formed on the hourly chart of USDJPY, which is acting as a resistance and preventing gains near 118.00-20.
- In Japan today, the All Industry Activity Index was released by the Ministry of Economy, Trade and Industry.
- The result was on the higher side, as there was an increase of 0.2% in Oct 2016, compared with the previous month.
USDJPY Technical Analysis
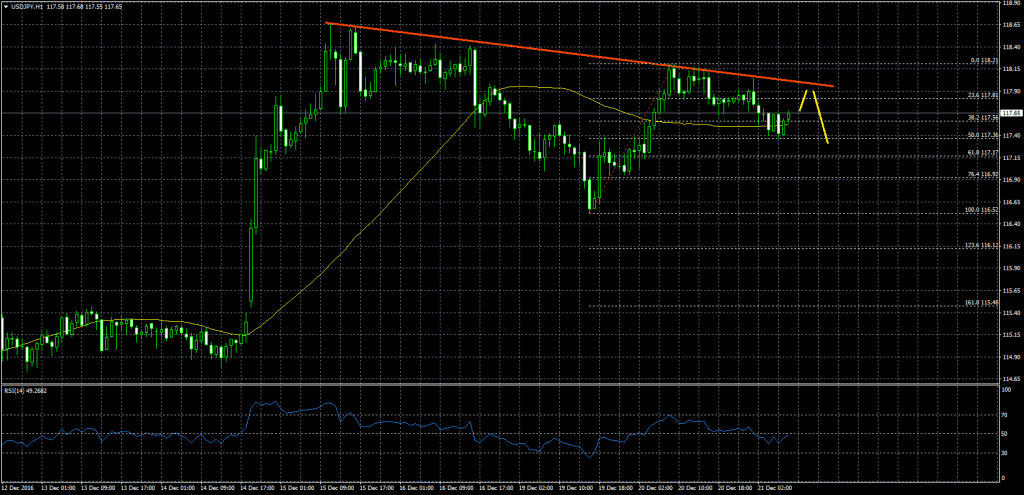
The US Dollar traded higher to post a close above the 21 hourly simple moving average against the Japanese yen. However, the USDJPY pair was contained by a bearish trend line formed on the hourly chart near 118.00-20.
The pair traded lower once again, but found buyers near the 50% Fib retracement level of the last wave from the 116.52 low to 118.21 high.
So, there is a chance that the pair may bounce back. However, the same trend line resistance near 118.00-20 holds the key. Only there is a break above it, there is a chance of more gains in USDJPY towards 118.50.
Japanese All Industry Activity Index
Today in Japan, the All Industry Activity Index, which captures the monthly change in overall production by all industries of the Japanese economy was released by the Ministry of Economy, Trade and Industry. The market was positioned for a minor increase of 0.15% in Oct 2016, compared with the previous month.
However, the result was on the higher side, as there was an increase of 0.2% in Oct 2016. It was same as of the last reading. Overall, the result helped the Japanese yen to gain a few pips in the short term.
The US dollar remains in an uptrend against the Japanese yen, but it needs to break the 118.20 hurdle for more gains.