Key Points
- The US Dollar after trading as high as 1.2530 found resistance against the Canadian Dollar and moved down.
- There was a break below a major bullish trend line with support at 1.2475 on the hourly chart of USDCAD.
- Recently in the US, the Total Vehicle sales for August 2017 report was released by the Autodata Corp.
- The outcome was above the forecast of 16.90M, as there was a rise from the last reading of 16.14M to 18.57M.
USDCAD Technical Analysis
The US Dollar made a decent ground this past week and moved above the 1.2500 handle recently against the Canadian Dollar. The USDCAD pair traded as high as 1.2530 where it faced offers and later started a downside correction.
The pair moved down and broke the 1.2500 handle along with the 21 hourly simple moving average. There was even a break below a major bullish trend line with support at 1.2475 on the hourly chart. The pair is now below the 50% Fib retracement level of the last wave from the 1.2407 low to 1.2530 high.
A close below 1.2450 and the 61.8% Fib retracement level of the last wave from the 1.2407 low to 1.2530 high would call for a complete test of the last swing low at 1.2407.
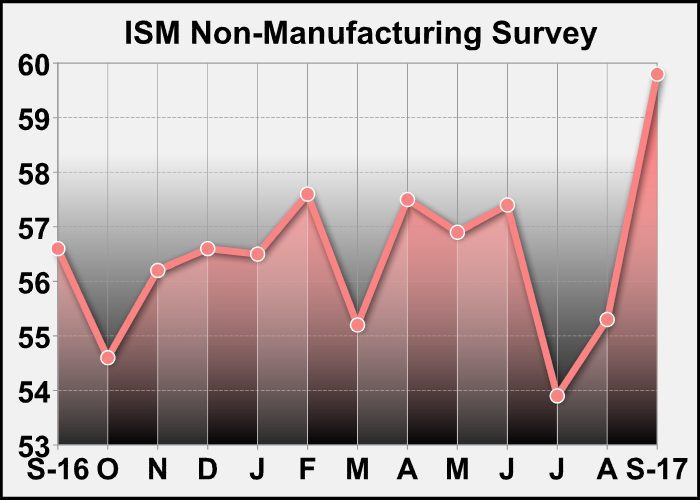
US Total Vehicle Sales
Recently in the US, the Total Vehicle sales for August 2017 report was released by the Autodata Corp. The market was positioned for a rise from the last reading of 16.14M to 16.90M.
The actual result was above the forecast of 16.90M, as there was a rise from the last reading of 16.14M to 18.57M. Moreover, the ISM NY index – Business Conditions for Sep 2017 was released by NAPM-New York. The result was below the forecast, as there was a decline from the last reading of 56.6 to 49.7.
Overall, the USDCAD pair might continue to extend its decline and could even test the 1.3400 support area in the near term.