Key Points
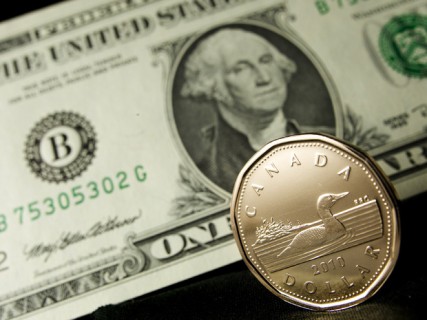
- The US dollar after trading as high as 1.3398 against the Canadian dollar found sellers.
- There is a major bullish trend line formed on the hourly chart of USDCAD, which the pair is attempting to clear at 1.3320.
- Today in the US, the Economic Optimism Index will be released by The Investor’s Business Daily (IBD) TechnoMetrica Institute of Policy and Politics (TIPP).
- The market is expecting a rise from the last reading of 46.7 to 47.6 in Oct 2016.
USDCAD Technical Analysis
The US Dollar after trading towards the 1.34 handle found sellers and started correcting lower. During the correction, the USDCAD pair traded as low as 1.3276 from where it started moving higher once again.

However, the recovery found sellers at 61.8% Fib retracement level of the last 1.3398 high to 1.3276 low, and as a result, there was a downside move. The pair is currently trading near a major bullish trend line formed on the hourly chart. If there is a close below the trend line support, it would ignite further losses may be towards the 1.3275 level.
The pair has already moved below the 21 hourly simple moving average, which is a bearish sign.
US Economic Optimism Index
Today in the US, the Economic Optimism Index, which measures the sentiment of consumers related to economic conditions will be released by The Investor’s Business Daily (IBD) TechnoMetrica Institute of Policy and Politics (TIPP).
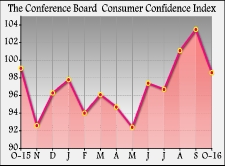
The market was aligned for an increase from the last reading of 46.7 to 47.6 in Oct 2016. On the other hand, the US Consumer Confidence is forecasted to decrease from 104.1 to 101.
If the result fails to impress the US Dollar buyers, there are chances of further declines in the near term in USDCAD towards 1.3260.