Natural gas declined in European trading hours on Friday, flipping yesterday’s rally which was supported by a supply report that was in line with expectations and a weakening U.S dollar, not to mention rising demand in Europe due to lower than usual wind-based power production and tightening of supplies.
The U.S. Energy Information Administration reported on Thursday that natural gas supplies rose by 62 billion cubic feet last week to a total stock of 3.499 trillion cubic feet. Data for the week ended Sept. 9 met forecasts calling for an average rise of between 59 billion and 63 billion cubic feet by analysts. In general, total stocks are up by 184 billion cubic feet from a year ago. This is 299 billion cubic feet(or just under 9%) above the five-year average.
European natural gas prices are currently supported by reduced nuclear power availability in France, tightening supply margins in the U.K. and lower wind-based power output in Germany coinciding with a late summer heatwave. Norwegian gas flows to Britain fell to 147 million cubic meters a day on Friday, combined with abnormally hot weather which has increased power generation activity. This is set to spike demand for natural gas in the UK, to 76 million cubic meters from 66 million cubic meters on Friday.
Thanks to tougher environmental standards around the world that give gas an advantage over other fossil fuels such as coal and oil, the commodity now accounts for about 50% of the world’s biggest energy/oil companies’ production, and this rate is expected to rise higher. A number of oil and gas companies are planning to boost their natural gas production by the end of this decade.
France’s Total SA plans to increase its LNG output by 50% by 2020. Britain’s BP PLC expects to increase its gas production by 44% in the next 4 years and Italy’s Eni SpA is also on course to ramp up its gas output during the same period.
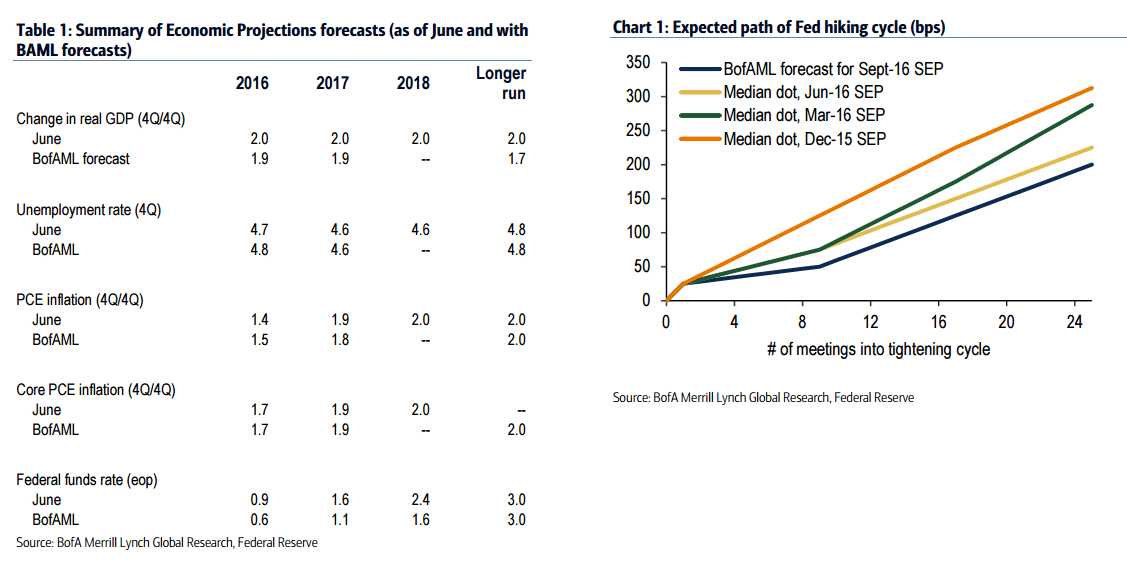
According to Bank of America Merrill Lynch, new LNG projects in Australia and the U.S. are foreseen to contribute to a 50% increase in global supply. An approximate amount of 135 million tons per year is expected to be added to production capacity by 2020. Capital expenditure on LNG production facilities is expected to reach $284 billion over the period of 2017 – 2021, which is twice as much as the investment amount during the 2012 – 2016 period.
Meanwhile, on the demand side in terms of medium/long term demand, demand in some traditional markets like Japan and South Korea is flat or declining, mostly because of slower economic growth and an increase in nuclear power generation in Japan.
That is the reason why big oil companies are shifting their attention to developing countries such as Ivory Coast, Morocco and Indonesia, when it comes to finding new markets with potential to generate demand. Jordan, Pakistan and Egypt were the biggest drivers of LNG demand this year. Wood Mackenzie, a U.K.-based consulting firm, forecasts that over the next decade, new LNG importers will likely account for 40 million tons of additional annual demand, expanding the global market by 16%.
In other relevant data reported recently, US natural gas rig count was at 92 in the week ending on September 9th. This is four more than the previous week but down by 104 over the past year, signifying the overall damage to US energy producers over the past year. The natural gas rig count for the week ending September 16 will be released by Baker Hughes (BHI) on September 16, 2016.
Fig: Natural gas H4 technical chart
Natural gas has been stuck in the range from 2.850 to 2.940 since the start of this week. Attempts to register a break out in either direction were unsuccessful in trading yesterday, and the commodity remains pinned with the recent trading range. The price action has reversed lower and is heading towards the lower boundary of the trading channel. The price has broken through the MA20 from above and is heading towards the MA50. However, the market is expected to run out of downward momentum as it approaches the 50-period moving average.
Trade suggestion
Buy Limit at 2.850, Take profit at 2.940, Stop loss at 2.800