Chart Created Using FXCM Marketscope 2.0
Technical Outlook
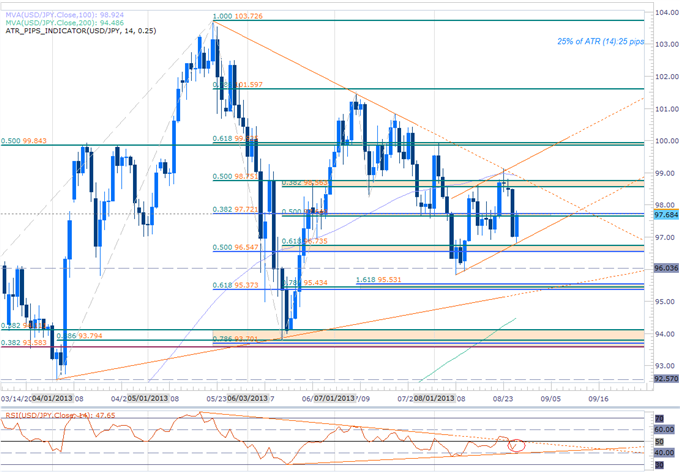
Interim support 96.55/74 (61.8% Retracement / 50% Fib Extension)
Interim resistance 97.65/72 (50% Retracement / 38.2% Fib Extension)
Topside breach targets 98.56/75 – Key resistance 99.84/92
Break below 96.54 targets Key support at 95.37/53 (April TL Sup / 78.6% Fib Ext / 38.2% & 88.6% Retracements)
Bullish Invalidation below 93.58
Daily RSI trigger pending for bullish break
Key Events: Retail Trade tonight, Jobless Rate and CPI tomorrow
Notes: The broader uptrend remains in focus above 95.37 as the pair continues to consolidate. Near-term topside break above 97.72 puts subsequent resistance targets in focus with a move (and close) above 98.75 targeting key resistance at 99.84/92. Long exposure is warranted if this level is surpassed. Daily RSI break below the 40-threshold with price action below 95.37 suggests a deeper correction is at play.
Gold Daily Chart
Technical Outlook
Rally halted at channel resistance- Key topside resistance objective $1440-1452
Breach risks a run on May highs at 1488 (also the 50% retracement off the 2012 high)
Interim support $1370/76 (61.8% retracement and Fib extension)
Support break targets $1345 / channel support
Daily RSI trigger pending for short entry
Notes: Gold has held within the confines of a well-defined ascending channel formation dating back to the June lows. The RSI signature was a true tell this month as we noted in the August 16th weekly forecast, “With the oscillator breaking above the 60-threshold for the first time since August 2012 and price action surpassing the previous monthly high for the first time since October 2012- both constructive developments for gold.” The yellow metal now eyes a key resistance range and while we favor the downside it’s important to note that a breach above would suggest a more significant uptrend may be in the making. A near-term support break below 1370/76 with RSI conviction puts subsequent downside targets back in focus.
USDOLLAR Daily Chart
Technical Outlook
Key support range noted last week Still in play 10,650/75
Medium-term bias bullish above this mark
Support break targets objectives at 10,580- 10,611
Broader outlook remains weighted to the topside above this mark
Daily RSI trigger break suggests mounting topside pressure
Topside resistance objectives 10,783- 10,800, 10,830 and 10,870.
Key Events Ahead: 2Q GDP (preliminary) Tomorrow, Personal Consumption/Spending and University of Michigan Confidence on Friday
Notes: Near-term price action looks constructive but we remain cautious as we head into the close of August trade with NFPs on tap next week and the September opening range in focus. Note that daily RSI held the 40-threshold throughout the decline off the July highs suggesting that the move remains corrective in nature. Look for a breach above the monthly open at 10,802 to offer further conviction on long-side exposure.
Trade these setups and more alongside DailyFX with Analyst on Demand
—Written by Michael Boutros, Currency Strategist with DailyFX
For updates on this scalp and more setups follow him on Twitter @MBForex
To contact Michael email mboutros@dailyfx.com or Click Here to be added to his email distribution list
Join Michael Tuesday, Wednesday and Thursday mornings for a Live Scalping Webinar on DailyFX Plus (Exclusive of Live Clients) at 1230 GMT (8:30ET)
Introduction to Scalping Strategies Webinar
DailyFX provides forex news and technical analysis on the trends that influence the global currency markets.Learn forex trading with a free practice account and trading charts from FXCM.
Source: Daily fx