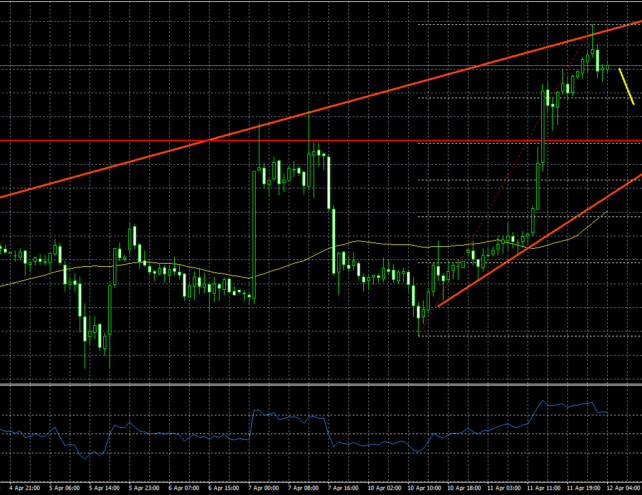
Key Points
- There was a good upside move in Gold price, as it moved above $1265 against the US Dollar.
- There is a connecting resistance trend line at $1278 on the hourly chart of Gold, which prevented further upsides.
- Today in China, the Consumer Price Index for March 2017 (YoY) was released by the National Bureau of Statistics of China.
- The outcome was below the forecast, as the Consumer Price Index increased 0.9%, less than the forecast of 1%.
Gold Price Technical Analysis
There was an upside move in Gold price above the $1262 and $1265 resistance levels against the US Dollar. The price traded towards $1280 where it found a connecting resistance trend line at $1278 on the hourly chart.
The price is currently correcting lower, and may test the 23.6% Fib retracement level of the last wave from the $1247 low to $1279 high.
However, the most important support is near $1267, which also coincides with the 38.2% Fib retracement level of the last wave from the $1247 low to $1279 high. So, if the price dips from the current levels, it could gain bids near $1267-65.
Chinese Consumer Price Index
Recently in China, the Consumer Price Index for March 2017 (YoY) was released by the National Bureau of Statistics of China. The forecast was lined up for a rise of 1% in March 2017, compared with the same month a year ago.
However, the result was below the forecast, as the Consumer Price Index increased 0.9%, less than the forecast of 1%. In terms of the monthly change, the Consumer Price Index declined 0.3% in March 2017. It was in line with the forecast, but more than the last decline of 0.2%.
Overall, there is a chance that Gold price may correct lower in the near term towards $1267-65 where is may find support.

