Key Points
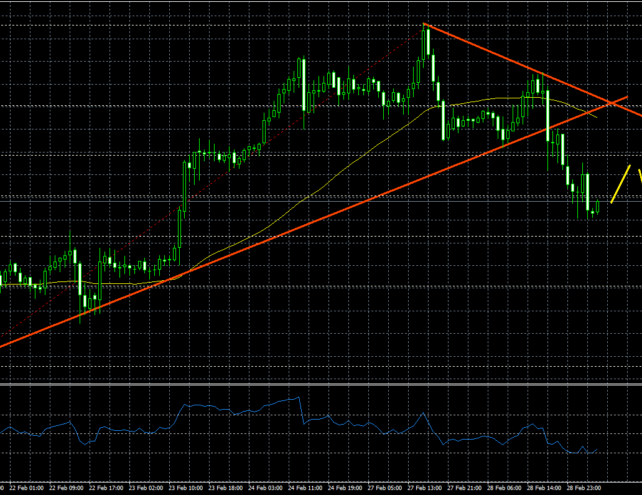
- Gold price after trading as high as $1263 found sellers and moved down against the US Dollar.
- There was a crucial bullish trend line with support at $1250 on the hourly chart, which was broken recently.
- Today in China, the Caixin China Manufacturing PMI for Feb 2017 was released.
- The result was above the forecast, as there was a rise from 51 to 51.7 in Feb 2017.
Gold Price Technical Analysis
There was a nice upside move in Gold price towards $1260 against the US Dollar until it found sellers near $1263 and started moving down. During the downside, the price broke the 23.6% Fib retracement level of the last wave from the $1225 low to $1263 high.
Later, there was a break below the 21 hourly simple moving average and a crucial bullish trend line with support at $1250 on the hourly chart.
The price is currently trading near the 50% Fib retracement level of the last wave from the $1225 low to $1263 high. Any corrections towards $1245 and $1250 may find resistance on the upside.
Chinese Caixin China Manufacturing PM
Today in China, the Caixin China Manufacturing PMI for Feb 2017 was released. It was forecasted to decline from 51 to 50.8 in Feb 2017.
The outcome was above the forecast, as there was a rise from 51 to 51.7 in Feb 2017. The report added that “Chinese manufacturing companies saw a stronger improvement in overall business conditions in February, with output and total new orders both rising at faster rates than at the start of the year”. In another release, the Manufacturing Purchasing Managers Index (PMI) released by the China Federation of Logistics and Purchasing (CFLP) for Feb 2017 posted a rise from 51.3 to 51.6. It was again better than the forecast of a decline to 51.1.
Overall, gold price remains at a risk of additional declines, and rallies towards $1250 might find sellers.

