Key Points
- The British Pound tumbled recently against the US Dollar, and opened the week below 1.2080.
- There is a bearish trend line formed on the hourly chart of GBPUSD, which may act as a resistance on the upside near 1.2120-1.2140.
- Today, the UK Rightmove House Price Index was released during the Asian session.
- The result was above the forecast, as there was a rise of 3.2% in Dec 2016, compared with the same month a year ago.
GBPUSD Technical Analysis
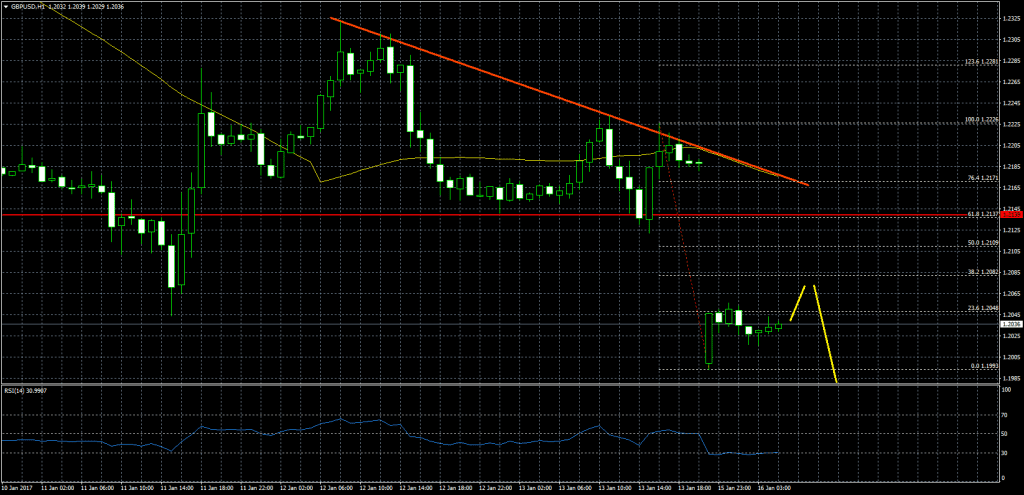
The British Pound was under a lot of bearish pressure, and opened this week with a gap lower below 1.2080. The GBPUSD pair traded as low as 1.1993 before starting a correction higher.
The pair is currently correcting higher, but finding sellers near the 23.6% Fib retracement level of the last decline from the 1.2226 high to 1.1993 low. Moreover, there is a bearish trend line formed on the hourly chart, which may act as a barrier for buyers near 1.2120-1.2140.
In short, if the pair attempts to trade higher, it may face a lot of resistance. One may consider selling as long as the market sentiment is bearish.
UK Rightmove House Price Index
Today during the Asian session, the UK Rightmove House Price Index, which provides a sample of residential property prices in the UK. It shows the strength of the UK housing market was released.
The result around the forecast, as was above the forecast, as there was a rise of 0.4% in Dec 2016, compared with the previous month. When we have a look at the yearly change, there was a rise of 3.2% in Dec 2016, compared with the same month a year ago.
Overall, there is a lot of bearish pressure on the British Pound due to fears of hard Brexit, which may weigh on the GBPUSD in the near term as long as it is below 1.2150-1.2200.