Key Points
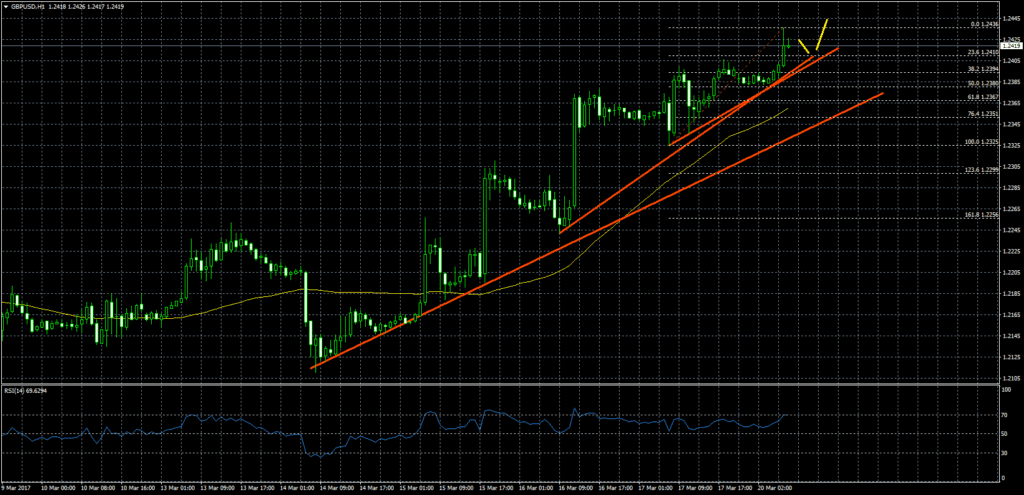
- The British Pound made a nice upside move recently, as it climbed above 1.2400 against the US Dollar.
- There are two bullish trend lines with support at 1.2400 formed on the hourly chart of GBPUSD.
- Today in the UK, the Rightmove House Price Index was released for Feb 2017.
- The result was on the lower side, as there was a rise of 1.3% in Feb 2017 (MoM), compared with the last +2%.
GBPUSD Technical Analysis
The British Pound started a nice recovery from the 1.2120 low against the US Dollar. There was a solid uptrend formed, as the GBPUSD pair moved above the 1.2200 and 1.2300 resistance levels. It also climbed above the 1.2400 resistance.
At the moment, there are two bullish trend lines with support at 1.2400 formed on the hourly chart, which can be considered as a major barrier for a downside move.
So, as long as the pair is above 1.2400, there can be a break above the recent high of 1.2436.
UK Rightmove House Price Index
Today in the UK, the Rightmove House Price Index, which provides a sample of residential property prices was released for Feb 2017. The market was expecting the index to increase by around 2% in Feb 2017, compared with the previous month.
The outcome was on the lower side, as there was a rise of 1.3% in Feb 2017 (MoM), compared with the last +2%. In terms of the yearly change, there was a rise of 2.3%, just as the last time. The report added that “Rightmove traffic at record January levels, with visits up 3% on January 2016’s buy-to-let boosted period. Investor sectors understandably quieter than this time last year on number of properties coming to market and number of properties sold‘.
Overall, the British pound has no real reason to move down, which is why there can be a move towards 1.2480 in the near term.