Key Points
- The Euro recently started correction against the US Dollar, but likely to face sellers near 1.0465 and 1.0500.
- There are many resistance levels and trend lines on the weekly chart of EURUSD, waiting to act as a hurdle on the upside.
- Recently in the US, the Institute for Supply Management (ISM) Manufacturing Index was released.
- The result was better, as there was an increase in the index from the last reading of 53.2 to 54.7 in Dec 2016.
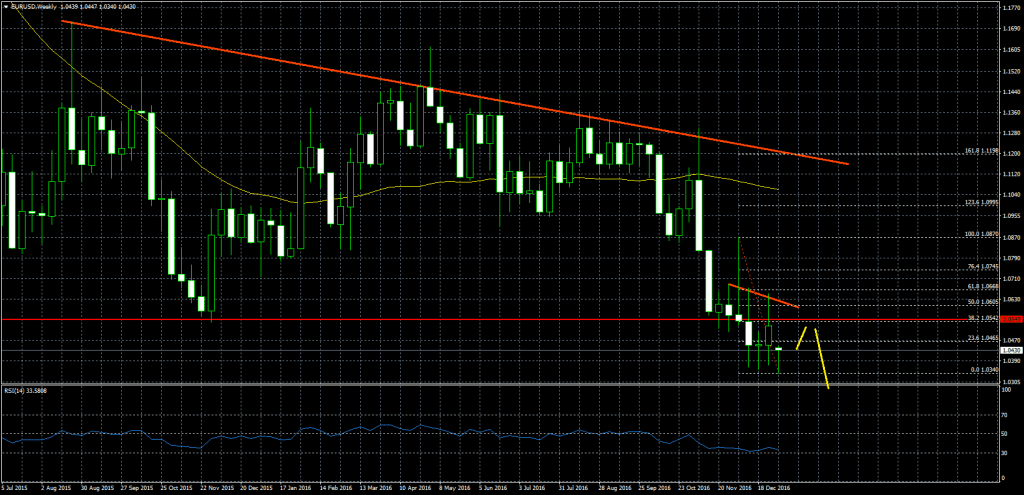
EURUSD Technical Analysis
The Euro recently gained bids near the 1.0350 level against the US Dollar, and started correcting higher. The upside move in EURUSD found sellers near the 23.6% Fib retracement level of the last decline from the 1.0870 high to 1.0340 low.
There are many resistances on the way up on the weekly chart of EURUSD at 1.0465 and 1.0500. If the pair continues to move higher, there is even a bearish trend line on the same chart.
On the downside, the most important support is near the last low of 1.0340. A break below it may push the pair towards 1.0300.
ISM Manufacturing Index
Recently in the US, the Institute for Supply Management (ISM) Manufacturing Index, which shows business conditions in the US manufacturing sector was released. The market was aligned for a minor increase from the last reading of 53.2 to 53.5 in Dec 2016.
The result was better, as there was an increase in the index from the last reading of 53.2 to 54.7 in Dec 2016. The report added that the “New Orders Index registered 60.2 percent, an increase of 7.2 percentage points from the November reading of 53 percent. The Production Index registered 60.3 percent, 4.3 percentage points higher than the November reading of 56 percent”.
Overall, the Euro may remain under a bearish pressure against the US Dollar, and may continue to trade lower.