The pattern in place in the DXY from March 2015 and May 2016 is very similar to that seen between July 2012 and May 2014.
Just as then, we believe this has simply been a pause in the USD uptrend and that the uptrend is resuming
The double 76.4% retracements off the lows (Green dotted line above) as well as the inverted head and shoulders (Blue dotted line above) completed 2 weeks ago support this view.
The target on this head and shoulders is 103.50+, which if seen, would take us above the pivotal trend high resistance at 100.40-100.50, thereby, completing a larger double bottom formation that would suggest as high as 108 with the channel top standing around 110.
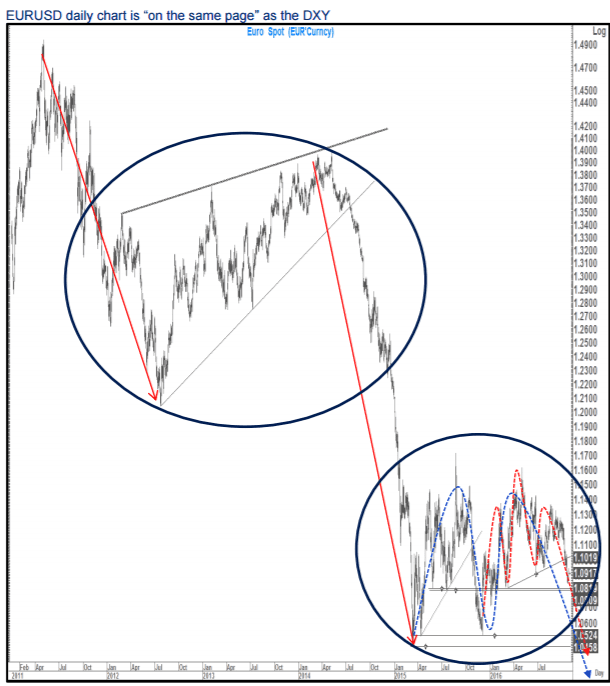
Not surprisingly (given its 57.6% DXY weighting) EURUSD looks very similar to the DXY (in reverse of course)
It has completed a clear head and shoulders top with a target of sub 1.03.
Such a target, if reached, would complete a breakout of the consolidation in place for the last 2 years, break to new trend lows and suggest a fall towards the mid-0.90s in EURUSD.
Good interim support ahead of these levels remains around 1.0810-20.
Citi maintains a short EUR/USD position* in its technical portfolio.
*This trade is recorded and tracked in eFXplus Orders.
Copyright © 2016 CitiFX, eFXnews™Original Article