Data released yesterday added more positive sentiment to the US economy, as durable goods orders in the US jumped up 3.4% in May, according to the Commerce Department report. For the preceding month, total orders for long-lasting manufacturing goods just increased 1.9%. In addition, initial jobless claims in the week ending May 20th declined more than expected. There were 268,000 people claiming unemployment insurance last week, compared with the number of 278,000 in the week before.
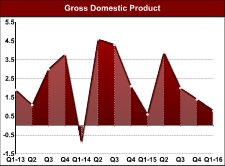
The Office for National Statistics on May 26 announced that in volume terms, UK GDP for the first quarter in 2016 advanced 0.4% from the quarter prior, extending the positive growth for 13 consecutive quarters. Based on current prices, nominal UK GDP rose by 0.7%, compared with the quarter ending December 2015.
Early Friday, the Bank of Japan reported that, after eliminating the costs of energy and fresh food, Japan’s consumer prices for April inched up 0.9% from one year earlier. The latest data was lower than the increase of 1.1% (on an annualized basis) in March.
Later Today, the G-7 meeting comes to a conclusion, with the markets closely observing any statements and comments that may provide some clues on economic policies and some solutions to spur global economic growth.
In the Asian trading session on Friday, oil retreated after hitting the threshold of $50/barrel due to oversupply concerns and a rising dollar. The global benchmark, Brent, currently is at $49.79, down 0.48% from the last settlement.
Technicals
GBPUSD
Fig. GBPUSD H4 Technical Chart
GBPUSD is in a bullish market overall, as seen in the green parabolics sar movement below the price chart. RSI is lingering around level 58 and heading down, suggesting weakening buying power. However, the pair is expected to continue its current up-move, retesting the resistance at 1.47389, the highest level since May 3.
Trade suggestion
Buy Call Option On A Break Above 1.47389 valid until May 27, 2016
Buy Put Option On A Break Below 1.46362 valid until May 27, 2016
EURJPY
Fig. EURJPY H4 Technical Chart
EURJPY has been moving sideways in a shrinking range around the area of 122.797. The red parabolics sar band is putting downward pressure on the pair, encouraging selling positions. RSI is staying at level 48 and pointing down, indicating a forming bearish market. The price is likely to hit the support at 122.218, the lowest level in more than 2 weeks.
Trade suggestion
Buy Call Option On A Break Above 123.335 valid until May 27, 2016
Buy Put Option On A Break Below 122.218 valid until May 27, 2016
AUDNZD
Fig. AUDNZD H4 Technical Chart
AUDNZD has been falling continuously, since the beginning of the month as seen in the wide range of red parabolics sar band above the price movement. However, the green trend indicator arrow has appeared recently, suggesting a bullish market in formation. With RSI staying above 50 and heading up, the pair is expected to hit the resistance level at 1.08082, formed on May 7.
Trade suggestion
Buy Call Option On A Break Above 1.08082 valid until May 27, 2016
Buy Put Option On A Break Below 1.07000 valid until May 27, 2016
SILVER
Fig. SILVER H4 Technical Chart
Silver prices have retreated significantly over the last few sessions, and silver is now trading at 16.254. The commodity is in a bearish market as seen in the red parabolics sar moving above. RSI is at level 39, indicating that the price is about to enter the oversold territory. The price is expected to continue falling, hitting the support level at 16.081 soon.
Trade suggestion
Buy Call Option On A Break Above 16.544 valid until May 27, 2016
Buy Put Option On A Break Below 16.081 valid until May 27, 2016
WTI
Fig. WTI H4 Technical Chart
WTI is in uptrend with the support of the green parabolics sar below. The up-trend indicator arrow has appeared since May 24, suggesting that the commodity is in a bullish market. RSI staying at above level 50 and heading towards the overbought zone, signals strong buying power. The price is expected to continue with its current surge.
Trade suggestion
Buy Call Option On A Break Above 50.31 valid until May 27, 2016
Buy Put Option On A Break Below 48.96 valid until May 27, 2016
DAX
Fig. DAX H4 Technical Chart
Currently, the DAX is in overbought territory with the RSI staying above level 70, with the possibility of a reversal soon. The bullish market has been in place since the appearance of the green trend indicator arrow and the parabolics sar band, on May 24. The index is anticipated to move sideways around the area of 10267.0 for the rest of the day, and it may reverse and hit the support level at 10169.1 later today or early next week.
Trade suggestion
Buy Call Option On A Break Above 10299.7 valid until May 27, 2016
Buy Put Option On A Break Below 10169.1 valid until May 27, 2016