On Wednesday, oil futures got closer to $50 per barrel, with the US crude prices reaching the highest level in more than 7 months, after a larger-than-expected drawdown in US crude inventories was reported last week. US crude futures hit $49.24 per barrel, up 62 cents compared with their last settlement, while Brent futures inched up 55 cents to as high as $49.16 per barrel.
The oil market was also supported by the surge in US equities and strong US home sales, which helped reinforce expectations that the Fed could tighten its benchmark rate in June.
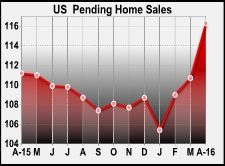
The US Commerce Department released new home sales data on Tuesday, with the number of new single-family homes sold during April reaching 619,000, the highest level in about 8 years, beating market expectations of 521,000. This provides more clear evidence of a pick-up in economic growth, which could allow the Fed to implement a rate hike sooner rather than later this year.
In Europe, Swiss exports were down in April in comparison with the same time last year, but still brought in more money as pharmaceutical companies increased their shipments more than 20%, which helped offset the drop in watch sales. Watch exports witnessed the 10th straight month of declines with a 200 million francs loss in April as the sales in Hong Kong and China continued to slide.
European shares were up on Tuesday, hitting the highest point in nearly a month, as firmer financial stocks lifted the region’s equity market. The FTSEurofirst 300 gained 2.2%, extending early gains on the weakening Euro and stronger oil prices.
Technicals
USDJPY
Fig. USDJPY H4 Technical Chart
The greenback is on its way to weakening against the yen, after testing the resistance of 110.164. The Stochastics chart shows that the pair is pulling back, and is escaping overbought territory. The price is expected to break level 23.6% of Fibonacci retracement once again. A selling position in the short-term is suggested.
Trade suggestion
Buy One Touch Call Option at 110.520 valid until May 25, 2016
Buy One Touch Put Option at 109.401 valid until May 25, 2016
EURGBP
Fig. EURGBP H4 Technical Chart
EURGBP is bouncing back from the three-and-half month low of 0.76076 formed yesterday. The signal trend indicator has encouraged a short position via a red arrow since May 13. Up to now, the pair has moved 2433 points, the largest gain from the beginning of this year. Hence, the price is likely to bounce back. The %K line (blue line) has already crossed over the %D line (red line) as shown on the stochastics chart.
Trade suggestion
Buy One Touch Call Option at 0.76737 valid until May 25, 2016
Buy One Touch Put Option at 0.76042 valid until May 25, 2016
CADCHF
Fig. CADCHF H4 Technical Chart
CADCHF is currently moving sideways in a wide range, between the support and resistance of 0.75093 and 0.76110, respectively. ADX (14) has lowered to 30.8191 with a small distance between DI+ and DI-, indicating that the up-move is weakening. A selling position has been indicated by the SAR red arrow hanging over the price chart.
Trade suggestion
Buy One Touch Call Option at 0.75961 valid until May 25, 2016
Buy One Touch Put Option at 0.75508 valid until May 25, 2016
GOLD
Fig. GOLD H4 Technical Chart
Falling sharply since May 18 with a loss of 4653 points up to now, GOLD is moving gingerly after testing the support of 1223.06. The stochastics chart shows that the commodity has dived into the oversold territory. The %K line (blue line) has already crossed above the %D line (red line), implying that a reversal into an uptrend may happen soon.
Trade suggestion
Buy One Touch Call Option at 1237.89 valid until May 25, 2016
Buy One Touch Put Option at 1214.25 valid until May 25, 2016
BRENT
Fig. BRENT H4 Technical Chart
The two moving averages have kept crossing each other and moving together for a long time now, giving no clear direction on the price movement. The price is currently fluctuating in the zone around level 23.6% of the Fibonacci retracement. It is expected to pull back for some consolidation before surging again. A green arrow has already appeared under the price chart, suggesting a long position.
Trade suggestion
Buy One Touch Call Option at 49.98 valid until May 25, 2016
Buy One Touch Put Option at 49.25 valid until May 25, 2016
FTSE
Fig. FTSE H4 Technical Chart
A higher-than average of RSI (14) shows that the bull is overshadowing the index. ADX (14) points up to 42.9841, with DI+ far higher than DI-, indicating that the upward pressure may not fade soon. The signal trend indicator has encouraged a long position since yesterday via a green arrow under the price chart.
Trade suggestion
Buy One Touch Call Option at 6307.31valid until May 25, 2016
Buy One Touch Put Option at 6197.03 valid until May 25, 2016