Oil prices are steady currently, ahead of today’s OPEC meeting in Vienna, which is not expected to provide any solutions on containing the oil oversupply. Iran and Saudi Arabia, the two largest oil exporters, have stated that they are not prepared to cut their production, in order to protect their market share.
Brent crude oil futures inched up 5 cents to $49.77 per barrel in comparison with their last settlement. Meanwhile, West Texas Intermediate (WTI) crude was trading at $48.92 per barrel, down 9 cents.
On Thursday, the dollar continued to fall against a basket of major currencies after the release of soft US economic data, which reduced hopes of a Fed rate hike next month. Data reported on Tuesday indicated that US consumer confidence slipped to as low as 92.6 compared with April’s 94.7 reading. Meanwhile, US manufacturing has gained for three consecutive months to May, but factories are slowing down on raw material deliveries from their providers, which could affect production in the following months.
According to the CME Group, market expectations that the Fed will raise interest rates in June, dropped to 22.5% from around 32% earlier this week. The curbed risk sentiment and concerns on Brexit have also put downward pressure on the greenback against safe-haven assets like the Japanese Yen and precious metals.
Against the dollar, the euro climbed 0.24 percent to $1.1208 ahead of the European Central Bank’s policy meeting later today. The ECB is widely predicted to hold steady on monetary policy.
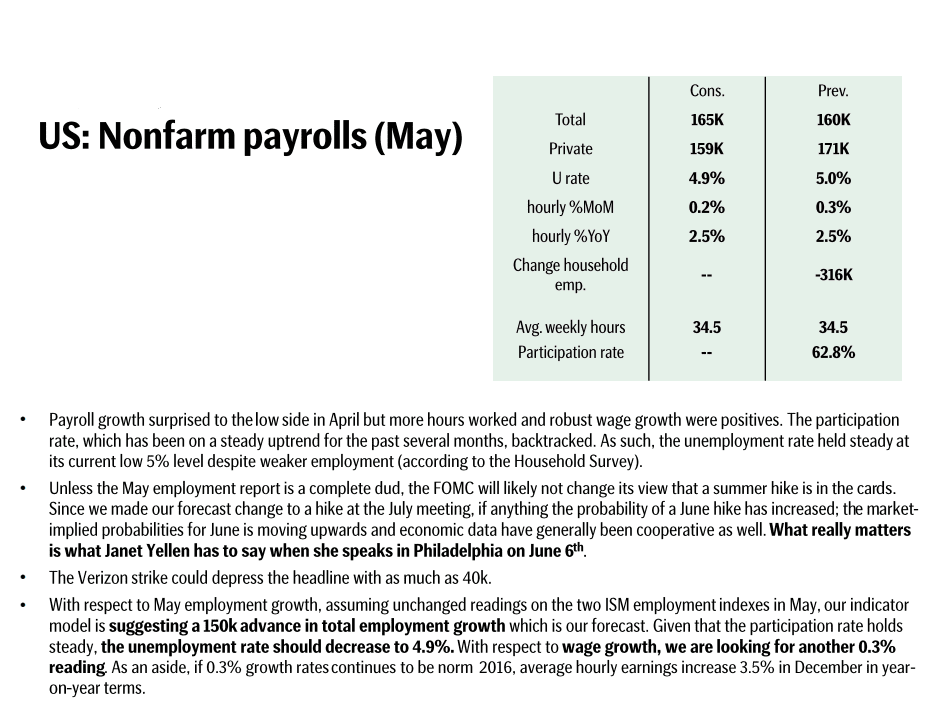
The non-farm payrolls report will be released tomorrow, and is the focus of attention for the market, for indications on the strength of the US labor market, which in turn is one of the biggest considerations for the FED in its overall assessment of the economy and the path towards monetary policy normalization.
Technicals
EURAUD
Fig. EURAUD H4 Technical Chart
The Euro is bouncing back against the Aussie, with the EURAUD surging higher from the one-month low of 1.52361. As shown by the stochastics chart, the pair has been in the overbought territory since a while and the distance between %K line and %D line is shrinking, hinting a reversal into a down-move. The price is expected to test the resistance around the area of 1.55555 and then pull back.
Trade suggestion
Buy Digital Put Option from 1.55454 to 1.54693 valid until 18:00 June 2, 2016
GBPJPY
Fig. GBPJPY H4 Technical Chart
GBPJPY is extending its fall after hitting the resistance of 163.900, the highest level since March 2016. ADX (14) is reading at 41.3107, with DI- much higher than DI+, indicating that the ongoing down move is powerful. A short position in this pair has been encouraged since yesterday as the signal trend indicator formed a red arrow over the price chart.
Trade suggestion
Buy Digital Put Option from 156.888 to 155.779 valid until 20:00 June 3, 2016
USDCAD
Fig. USDCAD H4 Technical Chart
Ahead of the Challenger ADP report on Non-farm employment change, USDCAD currently is moving in an unclear direction, around the area of the 23.6% Fibonacci retracement. RSI (14) hovers near the average, also giving no clear signals of price movement. The pair is expected to move sideways for several hours before resuming the uptrend. A breakout through the level 0 of Fibonacci retracement is likely to happen.
Trade suggestion
Buy Digital Call Option from 1.31098 to 1.31687 valid until 20:00 June 3, 2016
GOLD
Fig. GOLD H4 Technical Chart
On the last trading day of May, GOLD broke the two week old down-trend line after bouncing back from the support of 1199.45. ADX (14) has lowered to a reading of 19.7902, implying that the bear’s power is dying down. Hence, the price is anticipated to begin an uptrend after some sideways movement. as the break above the trend line seems significant.
Trade suggestion
Buy Digital Call Option from 1217.55 to 1228.44 valid until 20:00 June 3, 2016
COPPER
Fig. COPPER H4 Technical Chart
COPPER is halting for a bit after rising from the support of 2.0492. A smaller-than-average reading of RSI (14) indicates that the bear is casting its shadow on the price movement. The commodity is forecast to dim further, breaking the current support as signaled via the red trend signal indicator hanging over the price chart.
Trade suggestion
Buy Digital Put Option from 2.0649 to 2.0503 valid until 20:00 June 3, 2016
NASDAQ
Fig. NASDAQ H4 Technical Chart
NASDAQ seems quite languid under the resistance of 4530.95 after rising back up sharply from the support of 4280.40. RSI (14) shows that the index has escaped the overbought territory after being in this zone for a long period of time. Though the bull is still dominant, the bear is coming in, and is expected to gather enough energy to push the price down. The previously suggested long position, according to the trend indicator signal shows a gain of 1425 pip thus far, which is significant already. So a reversal into a downtrend may happen soon.
Trade suggestion
Buy Digital Put Option from 4499.28 to 4438.01 valid until 20:00 June 3, 2016