In the Asian trading session on Friday, oil prices were stable around the threshold of $50 per barrel, despite OPEC’s failure to agree on output targets. At the meeting on June 02, while Iran persisted with its stance of an output-increase to regain market share, Saudi Arabia committed not to stir the energy market with more fuel. Oil prices received further support as data from the US Energy Information Administration (EIA) reported that US crude stockpiles drew down for a second straight week, and inventories fell by 1.4 million barrels in the week ending May 27.
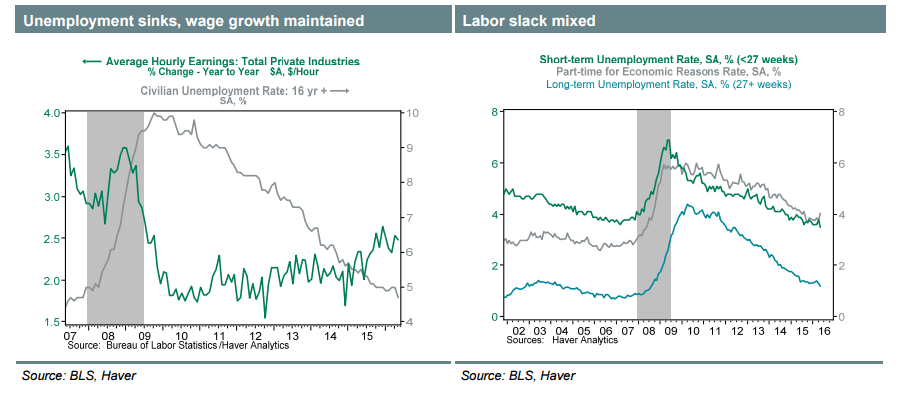
Meanwhile, after climbing higher following some positive data from US labor market overnight, the greenback is currently tiptoeing as investors turn their attention to the Non-farm payrolls report, which will be out later today. As reported by the ADP, there were 173,000 jobs added in the private sector last month, 7,000 higher than the previous reading. Meanwhile, initial jobless claims have decreased for four consecutive weeks, as the latest data for the week ending May 27 reported 267,000 people filing for unemployment benefits.
Today, the euro is moving in an unclear fashion against its peers after plummeting significantly after the ECB released its post meeting statement and held a press conference yesterday. ECB President Draghi commented that on the whole the risks to growth remain biased towards the downside as slow global growth around the world weighs on demand for exports of goods and services. The ECB chief expressed some concerns over the fact that individual governments within EU member countries would need to escalate the pace of structural and fiscal policy changes and support measures, to derive full benefits from the monetary policy efforts of the central bank to strengthen the EU economy.
Coming to a conclusion, the Governing Council of the European Central bank decided to hold its interest rates unchanged. Accordingly, the rate on the main refinancing operations, marginal lending facility and deposit facility still stay at 0.00%, 0.25% and -0.40% respectively.
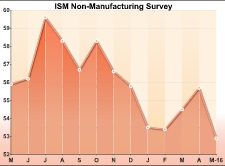
Late on Thursday Markit Economics reported that China’s service sector plunged to a three-month low in May due to the slowdown in new business and hiring activity. The Caixin Services PMI for last month contracted to 51.2, from a reading of 51.8 in the preceding month. Economists had expected the index would rise 0.2 points to 52.0 in May.
Technicals
EURUSD
Fig. EURUSD H4 Technical Chart
After dropping from the resistance at 1.12196, EURUSD is moving sideways around the area of 1.11493. RSI is lingering around level 46 and pointing down, signaling a downtrend is about to be formed. The price is anticipated to hover around the current levels for the rest of the day. After that, it may retest the support level at 1.11131, due to pressure from the two EMAs hovering above the price.
Trade suggestion
Buy Digital Put Option from 1.12196 to 1.11131 valid until 20:00 June 3, 2016
GBPAUD
Fig. GBPAUD H4 Technical Chart
GBPAUD has been under downward pressure from the parabolics band above the price, after rising to 2.05250. The price seems to have entered the oversold zone with RSI pointing down and the DI- (red line) crossing up through the DI+ (green line). The trend indicator hints at a bearish market with selling positions encouraged. The pair is expected to hit the support level at 1.98227 soon.
Trade suggestion
Buy Digital Put Option from 2.01070 to 1.98227 valid until 20:00 June 3, 2016
USDJPY
Fig. USDJPY H4 Technical Chart
USDJPY has pulled back slighly from around 108.469 to the current price 108.695. The trend indicator arrow has appeared since June 1 suggesting a down trend. The EMAs are hanging above the price, thus encouraging selling positions. However, RSI has consistently refused to enter the oversold area. The price is anticipated to pull back from the support of 108.469 and may hit the resistance level at around 110.546.
Trade suggestion
Buy Digital Call Option from 108.469 to 110.546 valid until 20:00 June 3, 2016
SILVER
Fig. SILVER H4 Technical Chart
Silver prices have fallen continuously from around 17.705 over the last 2 weeks. However, the price is currently witnessing a period of consolidation as indicators are showing an unclear trend. While RSI has crawled up to 47.76, all three lines of ADX are snaking through each other. An uptrend may be formed, and may push the price higher, if the support at 15.877 continues to hold.
Trade suggestion
Buy Digital Call Option from 15.916 to 16.155 valid until 20:00 June 3, 2016
DAX
Fig. DAX H4 Technical Chart
DAX is on track to continue rising. Its currently lingering around the area of the 61.8% Fibonacci retracement. The trend indicator suggests buy positions with the green arrow appearing more than 3 weeks ago. RSI is staying at level 56 and pointing to the overbought zone, signaling that the bull is dominant. The index is expected to test the zone of resistance at 10519.5 before pulling back.
Trade suggestion
Buy Digital Call Option from 10258.0 to 10519.5 valid until 20:00 June 3, 2016
SP500
Fig. SP500 H4 Technical Chart
RSI (14) is currently at the level of 62.6595, and knocking the doors to enter the overbought territory. This indicates drastic bullish power. After reaching the support of 2083.67 on the first day of June, the index is on its way to climbing higher. The index is anticipated to surge higher strongly in the short-term. A long position is signaled by the green trend arrow underpinning the price chart since May 24.
Trade suggestion
Buy Digital Call Option from 2082.47 to 2105.73 valid until 20:00 June 3, 2016