Key Points
- Gold price corrected lower recently towards $1282-80 against the US Dollar where it found support.
- There is a contracting triangle pattern with resistance at $1290 forming on the hourly chart.
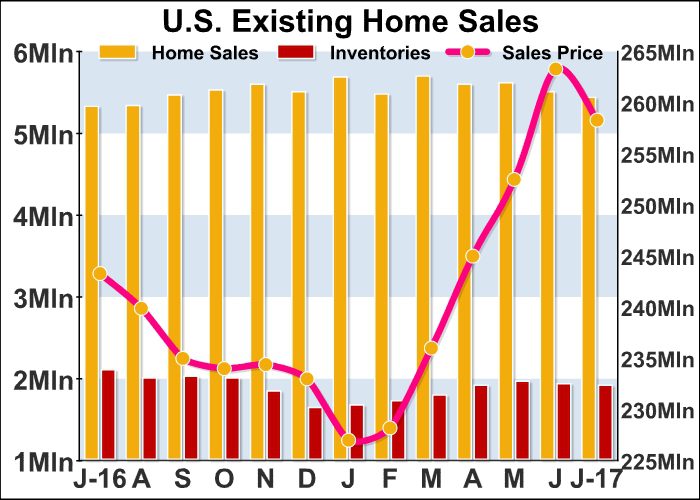
- Recently in the US, the number of New Home sales for July 2017 was released by the US Census Bureau.
- The outcome was below the forecast of +0.3%, as there was a decline of 9.4% in sales (MoM).
Gold Price Technical Analysis
We saw a decent rise in Gold price above $1280 as it moved towards the $1300 handle against the US Dollar. There was a high established at $1300.60 and later started a minor correction back towards the $1280.
The $1280 support is a decent buy zone and it is holding well. The price is currently trading nicely above $1280 and the 21 hourly simple moving average. On the upside, there is a contracting triangle pattern with resistance at $1290 forming on the hourly chart.
On the downside, the 21 hourly SMA and the triangle support at $1283 is a support zone. As long as the price stay above $1280, there can be more gains above $1290.
US New Home Sales Change
Recently in the US, the number of New Home sales for July 2017 was released by the US Census Bureau. The market was positioned for a minor increase in sales by 0.3% compared with the previous month.
The actual result was below the forecast of +0.3%, as there was a decline of 9.4% in sales. Sales of new single-family houses in July 2017 were down from the last revised rate of 0.630M to at a seasonally adjusted annual rate of 0.571M. The report stated that:
The seasonally-adjusted estimate of new houses for sale at the end of July was 276,000. This represents a supply of 5.8 months at the current sales rate.
Overall, there is a chance that Gold price could spike above $1290 to trade towards $1300 once again.