Key Points
- The Aussie dollar after trading as high as 0.7246 against the US Dollar found sellers, and moved down.
- There was a bullish trend line formed on the hourly chart of AUDUSD, which was broken at 0.7225.
- In Australia, the AiG performance of the Mfg Index was released by the Australian Industry Group.
- The result was better, as there was an increase in the index from the last reading of 54.2 to 55.4 in Dec 2016.
AUDUSD Technical Analysis
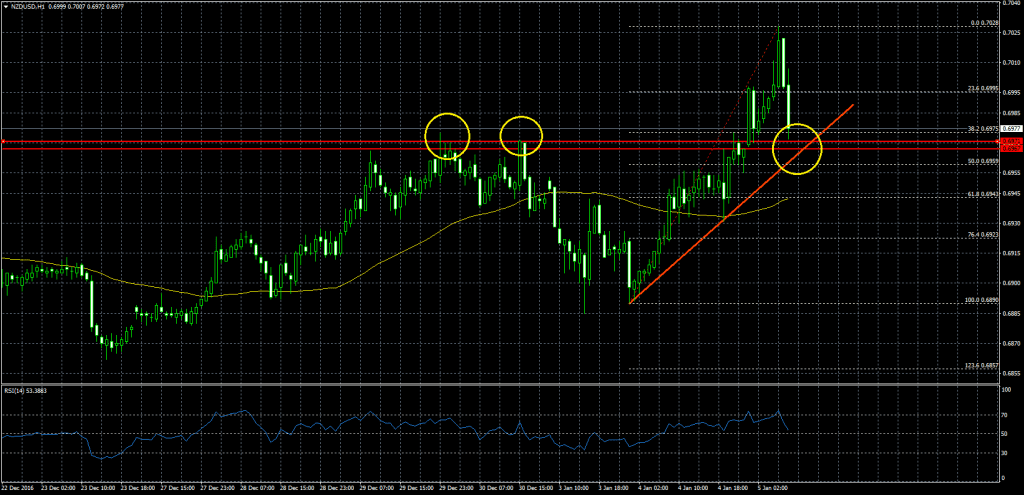
The Aussie dollar made a nice move when it traded above the 0.7200 level against the US Dollar. The AUDUSD pair traded as high as 0.7246 where it found sellers, and started moving down.

During the downside move, the pair broke a bullish trend line formed on the hourly chart of AUDUSD at 0.7225. Moreover, there was a close below the 23.6% Fib retracement level of the last wave from the 0.7164 low to 0.7246 high.
The pair is currently finding bids 21 hourly SMA, and may test the broken trend line where it could face sellers near 0.7225-30.
AIG Performance of the Mfg Index
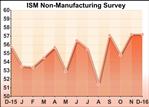
In Australia, the AiG performance of the Mfg Index, which presents business conditions in the Australian manufacturing sector was released by the Australian Industry Group. The market was aligned for no major increase in Dec 2016, compared with the previous month.
The result was better, as there was an increase in the index from the last reading of 54.2 to 55.4 in Dec 2016. The report added that the “Australian Industry Group Australian Performance of Manufacturing Index (Australian PMI®) increased by 1.2 points to 55.4 points in December, finishing 2016 with a solid expansion”.
However, there was no major upside move in the AUDUSD pair, as there was a bearish pressure below 0.7230.


