Key Points
- Australian Dollar traded down vs the US Dollar, and settled below the 100 hourly simple moving average.
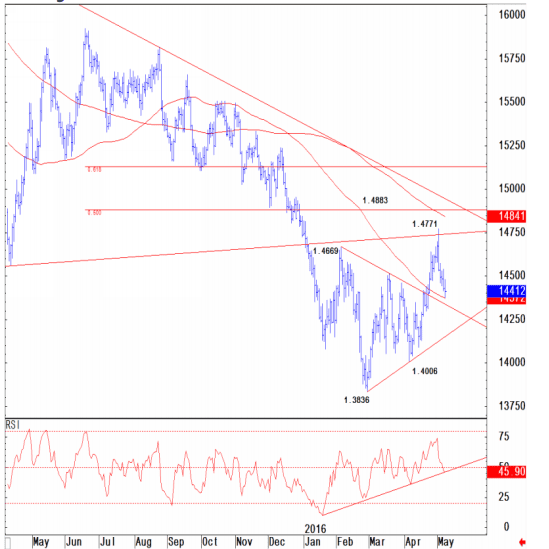
- There is an expanding triangle pattern formed on the hourly chart of AUDUSD, which may act as a reason for a downside move.
- Earlier today, the Chinese Consumer Price Index data were published by the National Bureau of Statistics of China.
- Chinese CPI registered a rise of 2.3% in April 2016, which was lower compared with the forecast of 2.4%.
Technical Analysis
The Aussie Dollar attempted a recovery on a couple of times vs the US dollar, but every time it found sellers. Currently, there is an expanding triangle pattern formed on the hourly chart of AUDUSD, which is acting as a resistance and stalling the upside in the pair.

The pair recently traded near the triangle resistance trend line where it found sellers, and started to move down.
There is a high probability that the pair may continue to move down and at least test the triangle support trend line.
Chinese CPI
Earlier today, there was a major release in China, as the Chinese Consumer Price Index data were published by the National Bureau of Statistics of China. The market was expecting a rise of 2.4% in the CPI in April 2016, compared with the same month a year ago.
However, the actual CPI came a bit lower, as the Chinese CPI increased by only 2.3%. In terms of the monthly change, there was decline of 0.2%. Moreover, the Producer Price Index which is a measurement of the rate of inflation experienced by producers posted a decline of 3.4% in April 2016 (YoY).
Overall, the Aussie Dollar bulls were not impressed by the outcome, which escalated the risk of more losses in AUDUSD.