Key Points
- The Aussie dollar declined from the 0.7950 high against the US Dollar and declined below 0.7850.
- There is a key bearish trend line forming with resistance at 0.7840 on the hourly chart of AUDUSD.
- Recently in Australia, the TD Securities Inflation report for Sep 2017 was released by The University of Melbourne – Faculty of Economics and Commerce.
- The outcome was above the forecast of 0.2%, as there was a rise of 0.3% in the TD Securities Inflation.
AUDUSD Technical Analysis
The Aussie dollar failed to hold gains above the 0.8000 handle and moved below 0.7950 against the US Dollar. The AUDUSD pair traded lower and broke a couple of key support levels such as 0.7900 and 0.7850.
The pair also closed below the 21 hourly simple moving average and traded as low as 0.7800. Later, the pair started a correction and traded above the 23.6% Fib retracement level of the last decline from the 0.7883 high to 0.7800 low.
On the upside, there is a key bearish trend line forming with resistance at 0.7840 on the hourly chart. It might act as a sell zone along with the 21 hourly SMA and the 50% Fib retracement level of the last decline from the 0.7883 high to 0.7800 low.
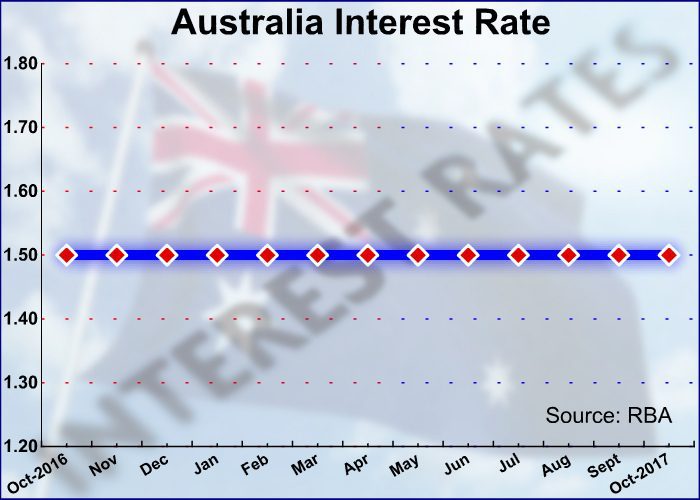
Australia’s TD Securities Inflation
Recently in Australia, the TD Securities Inflation report for Sep 2017 was released by The University of Melbourne – Faculty of Economics and Commerce. The market was positioned for a rise of 0.2% compared with the previous month.
The actual result was above the forecast of 0.2%, as there was a rise of 0.3% in the TD Securities Inflation. It was also a lot higher compared with last reading of 0.1%. In terms of the yearly change, there was a rise of 2.5%, which was lower compared with the last +2.6%.
Overall, the AUDUSD pair remains in a downtrend and it could even break the 0.7800 support in the near term.