Key Points
- The Aussie dollar recently traded higher against the New Zealand Dollar, but found resistance near 1.0462.
- There is a contracting triangle pattern formed on the hourly chart of AUDNZD, which is acting as a resistance and taking the pair down.
- Today in Australia, the House Price Index was released by the Australian Bureau of Statistics.
- The result was lower compared with the forecast of 2.3%, as it came in at 1.5% in Q3 2016.
AUDNZD Technical Analysis
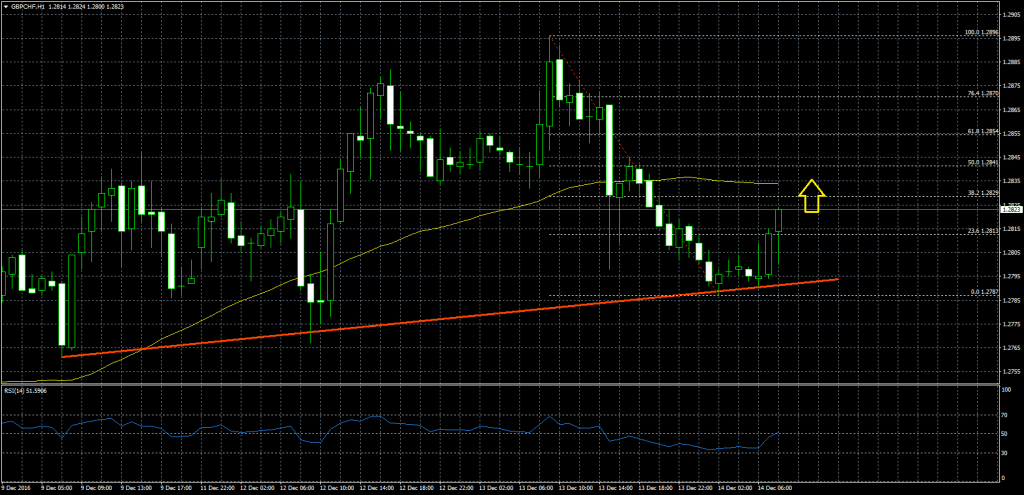
The Aussie dollar has a solid support at 1.0380 against the Kiwi dollar. The AUDNZD pair attempted to break the stated level many times, but failed. Later, the pair started a recovery and traded as high as 1.0462.

The pair failed to hold the bullish momentum, and started a decline. There is a contracting triangle pattern formed on the hourly chart, which is currently acting as a resistance at 1.0415 and taking the pair down.
It looks like the pair may continue to move down, and retest the same 1.0380 support area where buyers might appear again.
Australian House Price Index
Today in Australia, the House Price Index, which shows changes in housing prices of major cities in Australia was released by the Australian Bureau of Statistics. The market was expecting an increase of 2.3% in Q3 2016, compared with the previous quarter.
However, the result was lower, as the House Price Index increased 1.5%. The report added that the “capital city residential property price indexes rose in Sydney (+2.6%), Melbourne (+1.7%), Adelaide (+0.9%), Brisbane (+0.2%), Canberra (+0.8%) and Hobart (+2.3%) and fell in Perth (-1.6%) and Darwin (-1.2%).”
Overall, the Aussie dollar remains under a bearish pressure and may retest the last swing low of 1.0380 against the Kiwi Dollar.