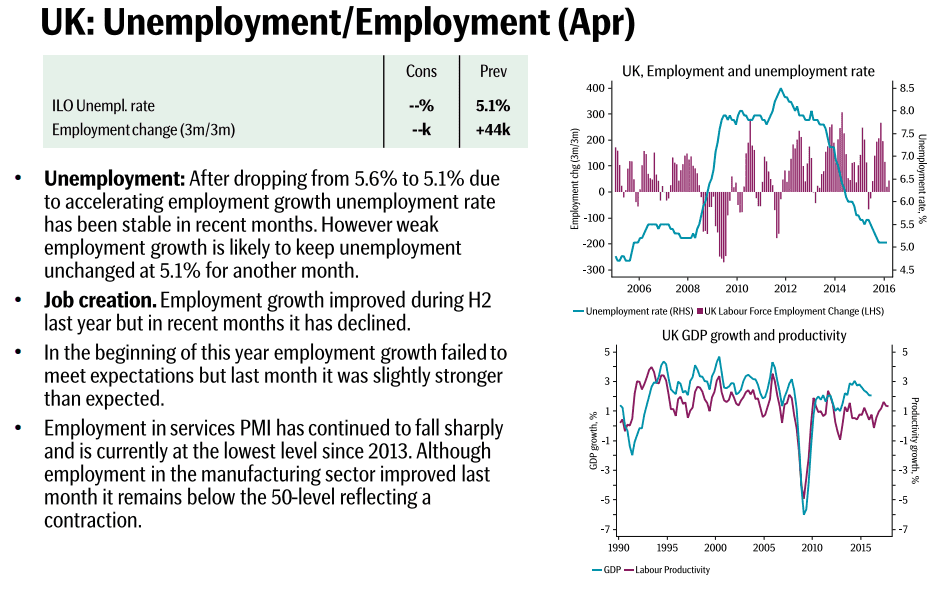
Key Points
- The US Dollar traded lower vs the Japanese yen recently, and remains poised for more losses.
- There is a bearish trend line formed on the hourly chart of the USDJPY pair, which can be seen as a sell zone.
- Japanese Industrial Production released by the Ministry of Economy, Trade and Industry posted a rise of 0.5% in April 2016, more than the forecast of 0.4%.
- Japanese Capacity Utilization posted a decline of 1% in April 2016, missing the forecast completely.
Technical Analysis
The US Dollar traded down vs the Japanese yen and tested the 105.60 support area. The USDJPY pair is currently attempting a recovery, but may face sellers near a bearish trend line formed on the hourly chart.

Moreover, the 50% Fib retracement level of the last drop from the 106.36 high to 105.58 low may also act as a resistance for the pair in the short term.
Overall, selling rallies can be considered as long as the pair is below the trend line and resistance area.
Japanese Industrial Production
Today, the Japanese Industrial Production was released by the Ministry of Economy, Trade and Industry. The market was expecting a rise in the measured output of the Japanese factories and mines. The result was positive, as there was an increase of 0.5% in the production in April 2016, compared with the previous month.
In terms of the yearly change, the Japanese Industrial Production decreased by 3.3% in April 2016, which was disappointing. Moreover, the Japanese Capacity Utilization posted decline of 1% in April 2016, which was again not what the market expected.
In short, the USDJPY pair may recover a few pips from the current levels, but the trend line resistance might act as a resistance.