In the US, the number of people claiming for unemployment benefits last week dropped unexpectedly, indicating sustained labor market strength in spite of disappointing nonfarm data last month. Specifically, claims hit 264,000, down nearly 1.5% compared with a reading of 268,000 the week before.
On Thursday, US wholesale inventories witnessed the biggest surge in 10 months in April at 0.6%, while being forecast at just 0.1%. This is expected to raise the market’s second quarter GDP growth estimates.
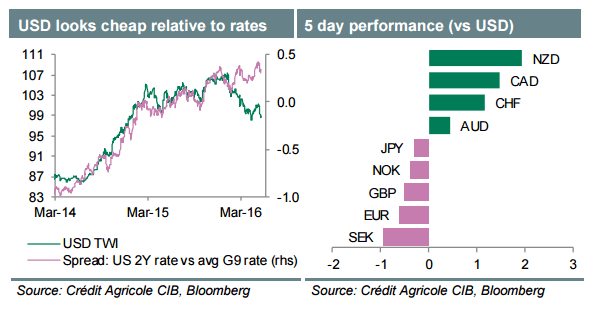
The dollar gained slightly on Friday against other major currencies, having bounced off one-month lows, as the British pound and the Euro stayed under downward pressure from market concerns over the risks of Britain leaving EU.
The sterling fell to as low as $1.44480 today, down 1.46% from the 10-day high created on May 6. The dollar index, measuring the strength of the dollar against the basket of major currencies, rose to 95.800 from yesterday’s 94.051.
Oil prices are stable in early trading today, due to the strong demand and global supply disruption. However, the stronger dollar has made oil more expensive for countries using other currencies to import the commodity, keeping crude prices below 2016’s highest level of 52.17 reached earlier this week.
International Brent crude oil futures were up 1 cent compared with their last settlement to as high as $51.96 per barrel. U.S. West Texas Intermediate (WTI) futures stayed flat at around $50.88 per barrel.
Technicals
USDJPY
Yesterday, USDJPY failed to break the level 0 of Fibonacci retracement and pulled back to rise up to as high as 107.263. The uptrend has been halted by a flexible resistance – the MA 20. ADX (14) is nose-diving from the peak of 52.86 to as low as 32.32, with the –DI line crossing over the +DI line. A short position is encouraged. USDJPY is likely to fall back and retest yesterday’s trough at 106.235.
Trade suggestion
Buy Digital Put Option from 106.887 to 106.512 valid until 20:00 June 10, 2016
EURGBP
Since late yesterday, EURGBP has been stuck in a narrow range between 0.78048 and 0.78324. The short-term SMA (14) has just crossed the long-term SMA (21) from below, indicating that a bullish market may be forming. However, RSI (14) still hovers close to the average. Hence, the price is expected to continue sideways for a while before surging up.
Trade suggestion
Buy Digital Call Option from 0.78279 to 0.78541 valid until 20:00 June 10, 2016
CADCHF
After falling from a one-month high of 0.76719 on May 26, the Loonie has fluctuated in an unclear fashion against the Swissie, forming a rectangular sideways channel on the price chart. The two moving averages have been sticking close together for a long time, and still have not provided any evident signals of a new trend. A selling position in short-term is encouraged as the price seems to have given up its advance after hitting a solid resistance at 0.75909.
Trade suggestion
Buy Digital Put Option from 0.75624 to 0.75313 valid until 20:00 June 10, 2016
GOLD
The precious metal is consolidating after testing the resistance of 1271.22 yesterday. ADX (14) is pointing down, indicating that the bullish power seems to be weakening. However, based on recent moves in gold prices, this slide seems to be just a temporary correction. The commodity may resume its up-move after testing the 61.8% Fibonacci or the support line which had acted as a firm resistance before.
Trade suggestion
Buy Digital Call Option from 1269.87 to 1275.22 valid until 20:00 June 10, 2016
COPPER
COPPER currently is inching down, trimming losses and bouncing back from the support of 2.0115. RSI (14) has lowered to a reading of 36.6492, implying that the bearish energy is still strong and dominating the bullish one. The commodity is forecast to retest the support formed yesterday. A short position is suggested by the red trend indicator hanging over the price chart.
Trade suggestion
Buy Digital Put Option from 2.0294 to 2.0173 valid until 20:00 June 10, 2016
FTSE
On June 09, FTSE created a big gap-down and since then the index has continued a down move from then up to now. The stochastics chart shows that the %K line (blue line) moved into the oversold territory and has already reversed. Hence, the 38.2% level of Fibonacci retracement is likely to be tested and to act as a support for the prices. After that, FTSE may climb up and cover the gap mentioned above.
Trade suggestion
Buy Digital Call Option from 6239.49 to 6273.15 valid until 20:00 June 10, 2016


