Key Points
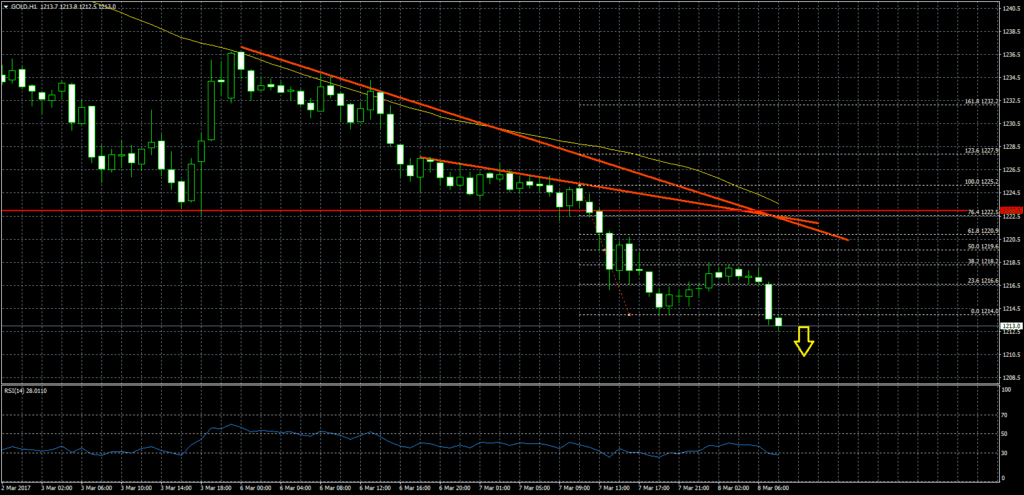
- There was a sharp downside in gold price, pushing it below the $1220 support vs the US Dollar.
- There are a couple of bearish trend lines formed on the hourly chart with resistance near $1220.
- Today in China, the Trade Balance figure for Feb 2017 was released by the General Administration of Customs of the People’s Republic of China.
- The result was below the forecast, as there was a trade deficit of $-9.15B, whereas the market was expecting a surplus of $51.4B.
Gold Price Technical Analysis
There was a decline in gold price during the past 3-4 sessions, as the price broke a major support area at $1220. It resulted in additional declines, taking the price towards $1210. The price may now look to extend losses towards the $1205 level.
On the upside, there are a couple of bearish trend lines formed on the hourly chart with resistance near $1220. The stated level was a support earlier, so $1220 might now act as a crucial resistance.
The same level also coincides with the 61.8% Fib retracement level of the last decline from the $1225 high to $1214 low.
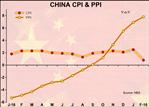
Chinese Trade Balance
Today, the Chinese Trade Balance report for Feb 2017 was released by the General Administration of Customs of the People’s Republic of China. The market was expecting the balance between exports and imports of total goods to post a surplus of $51.4B.
The outcome was below the forecast, as there was a trade deficit of $-9.15B. According to the report, the Chinese imports rose 38.15 in Feb 2017, compared with the last 16.7%. On the other hand, the exports declined 1.3%, compared with the last increase of 7.9%.
Overall, there was hardly anything to cheer for gold buyers, which puts the price at a risk of more declines towards $1205.