Key Points
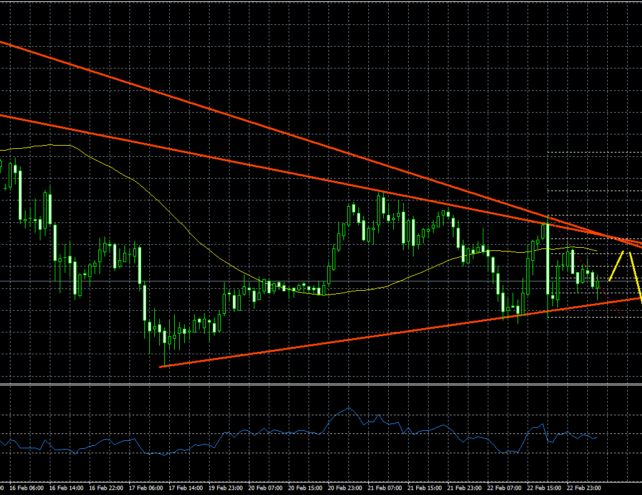
- The US Dollar is in a downtrend against the Japanese yen with resistance on the upside at 113.40.
- There are two major bearish trend lines with resistance at 113.40 on the hourly chart of USDJPY.
- In Japan today, the Coincident Index for Dec 2016 was released by the Cabinet Office.
- The result was neutral, as there was a minor decline from the last revised reading of 115.1 to 114.8 in Dec 2016.
USDJPY Technical Analysis
The US Dollar was seen struggling recently against the Japanese yen, as every recovery towards 113.50-60 was sold. The USDJPY pair now faces two major bearish trend lines with resistance at 113.40 on the hourly chart.
Moreover, the pair is also below the 21 hourly simple moving average with resistance at 113.38. If the pair continues to fail, there is a chance of a downside move.
On the downside, there is a bullish trend line with support at 113.10. A break below the trend line support could ignite further declines towards 112.80. One may consider selling rallies with stop above 113.50.
Japanese Coincident Index
Today in Japan, the Coincident Index, which is a single summary statistic that tracks the current state of the Japanese economy was released for Dec 2016 by the Cabinet Office. The market was not expecting any major decline from the last reading of 115.2 in Dec 2016.
The outcome was neutral, as there was a minor decline from the last revised reading of 115.1 to 114.8 in Dec 2016. On the other hand, the Leading Economic Index for Dec 2016 posted an increase from the last revised reading of 102.6 to 104.8.
Overall, the US Dollar may find it very tough to break the trend line resistance at 113.40, which is why USDJPY may decline towards 112.80.

