Key Points
- The Aussie dollar traded with a positive bias recently and currently positioned above the 0.7660 support area against the US Dollar.
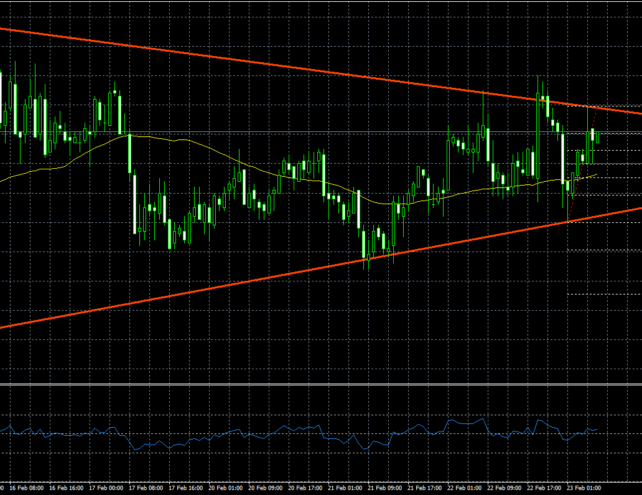
- There is a major contracting triangle pattern with resistance at 0.7705 formed on the hourly chart of AUDUSD.
- Today in Australia, the Private Capital Expenditure for Q4 2016 was released by the Australian Bureau of Statistics.
- The result was a bit lower than the forecast, as there was a decline of 2.1% in Q4 2016, compared with the -1% forecast.
AUDUSD Technical Analysis
The Aussie dollar recently recovered from the 0.7655 low against the US Dollar, and moved above the 21 hourly simple moving average. It looks like the AUDUSD pair has formed a major contracting triangle pattern with resistance at 0.7705 formed on the hourly chart.
The pair is moving higher, and attempting a break above the triangle resistance at 0.7705. If the AUDUSD bulls succeed, there can be further upsides towards 0.7730.
On the downside, the 21 hourly simple moving average is a support area at 0.7680. One may consider buying dips as long as the pair is above the triangle support trend line at 0.7660.
Australian Private Capital Expenditure
Today in Australia, the Private Capital Expenditure for Q4 2016 was released by the Australian Bureau of Statistics. It measures current and future capital expenditure intentions of the private sector and was forecasted to decline by 1% in Q4 2016.
The outcome was a bit lower than the forecast, as there was a decline of 2.1% in Q4 2016. The report added that the “trend volume estimate for total new capital expenditure fell 3.1% in the December quarter 2016 and the seasonally adjusted estimate fell 2.1%. The trend volume estimate for buildings and structures fell 4.7% in the December quarter 2016 and the seasonally adjusted estimate fell 4.1%”.
Overall, there are high chances of the Aussie dollar breaking the 0.7705-10 resistance for a move towards 0.7730 in the short term.

